 5
5peptides
spectra
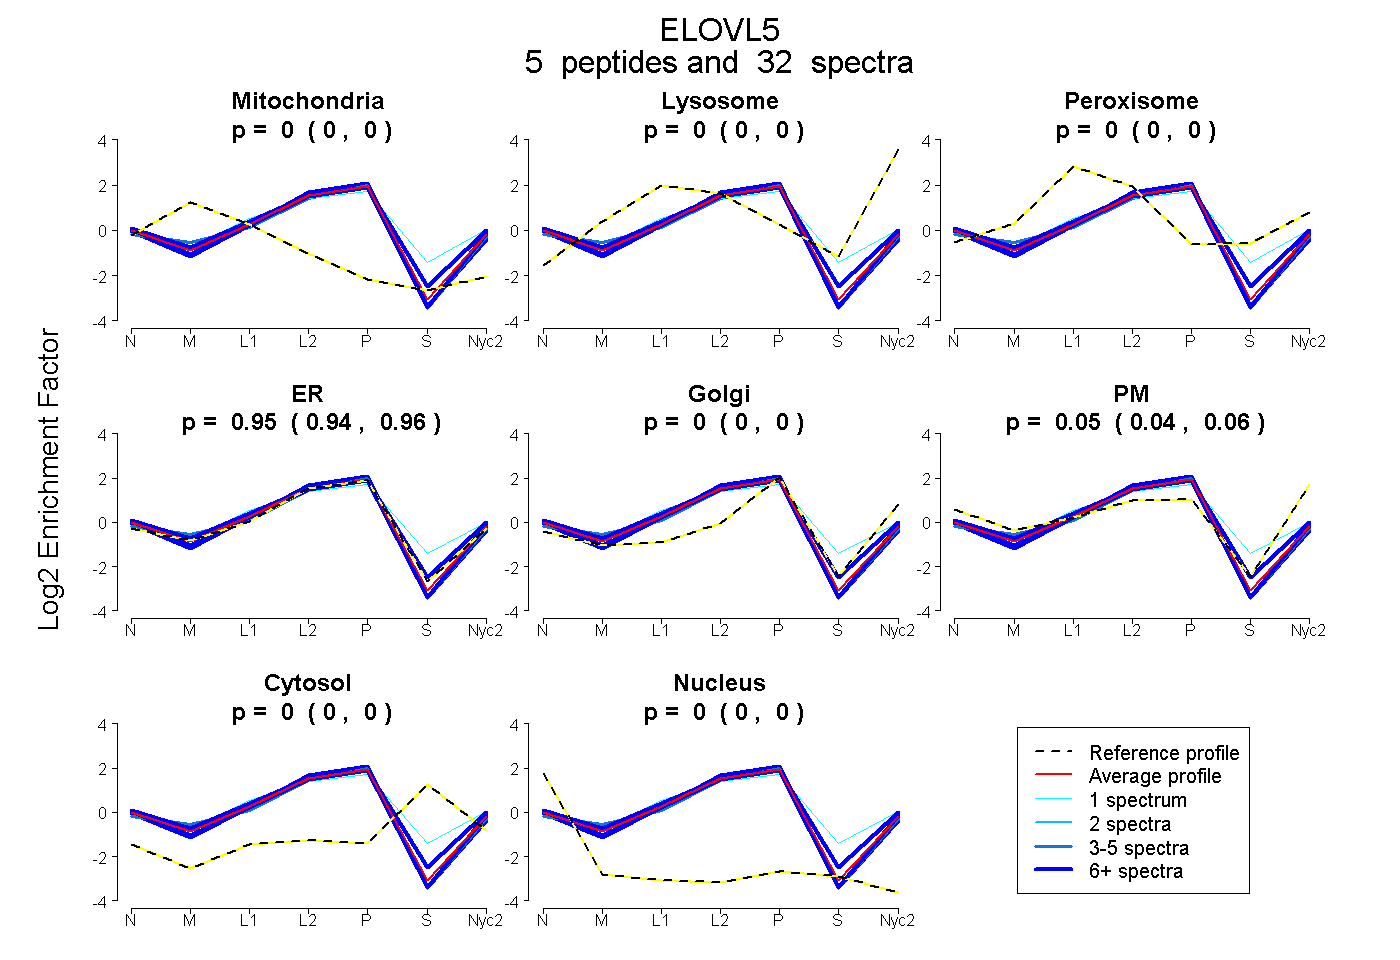
0.000 | 0.000
0.000 | 0.000
0.000 | 0.000
0.938 | 0.960
0.000 | 0.000
0.038 | 0.059
0.000 | 0.000
0.000 | 0.000
1peptide
spectra
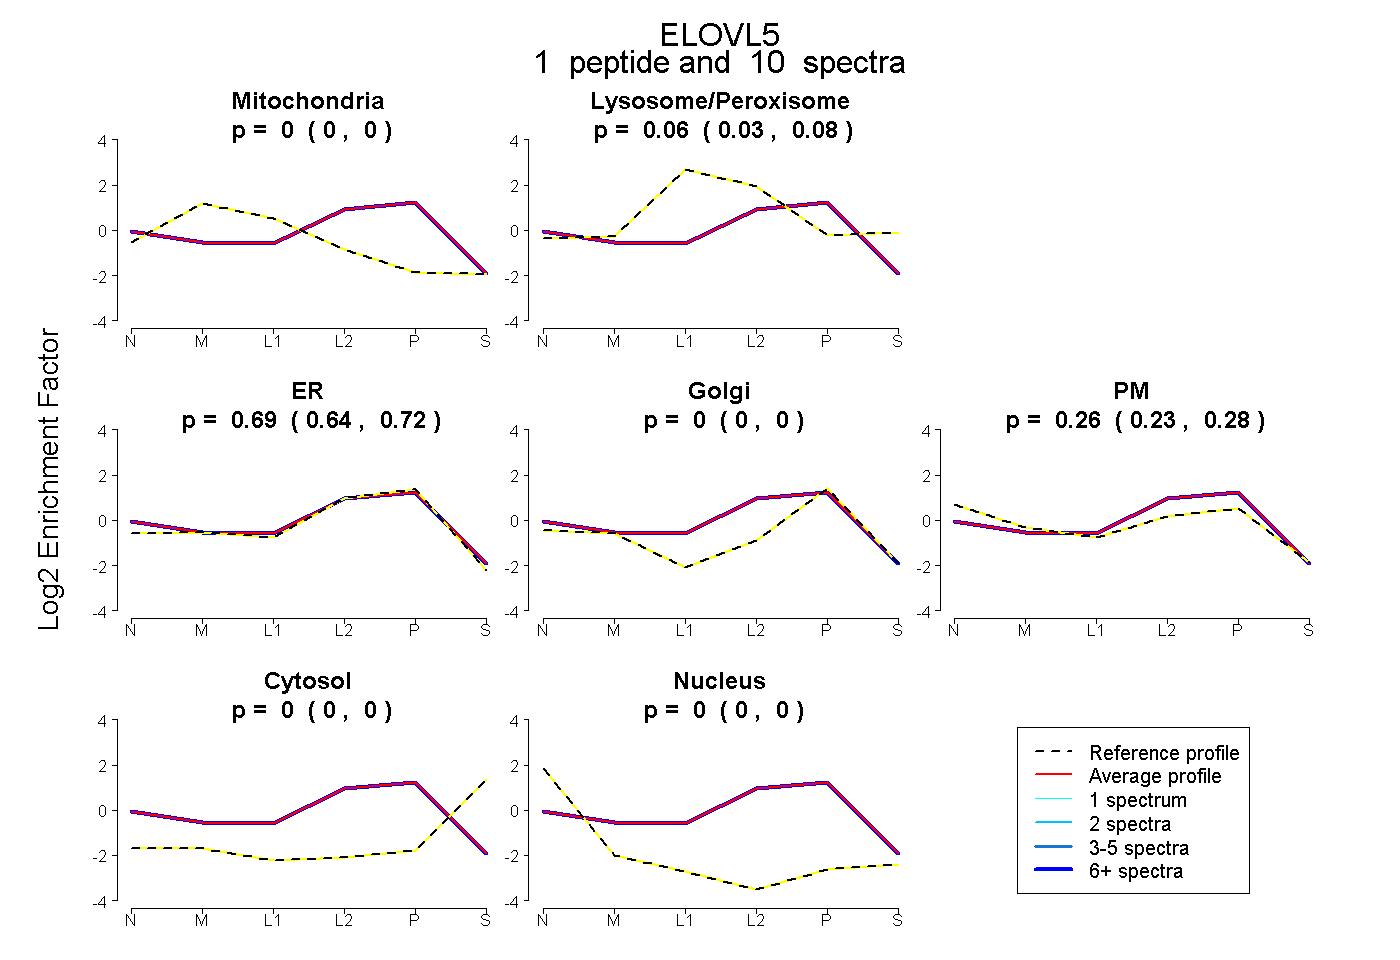
0.000 | 0.000
0.030 | 0.077
0.640 | 0.717
0.000 | 0.000
0.232 | 0.279
0.000 | 0.000
0.000 | 0.000
4peptides
spectra
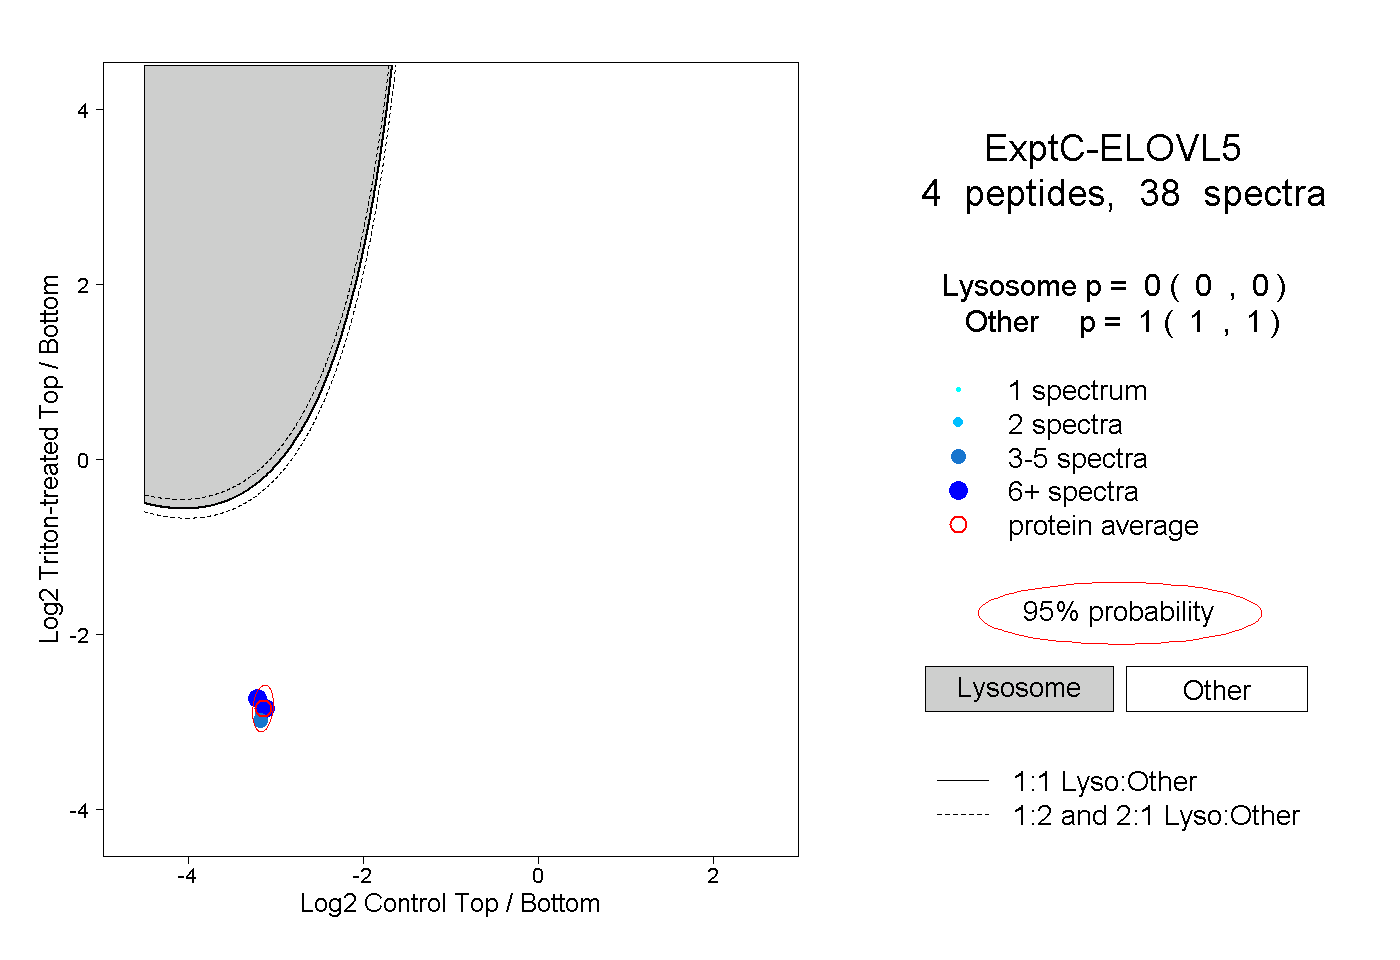
0.000 | 0.000
1.000 | 1.000
1peptide
spectra
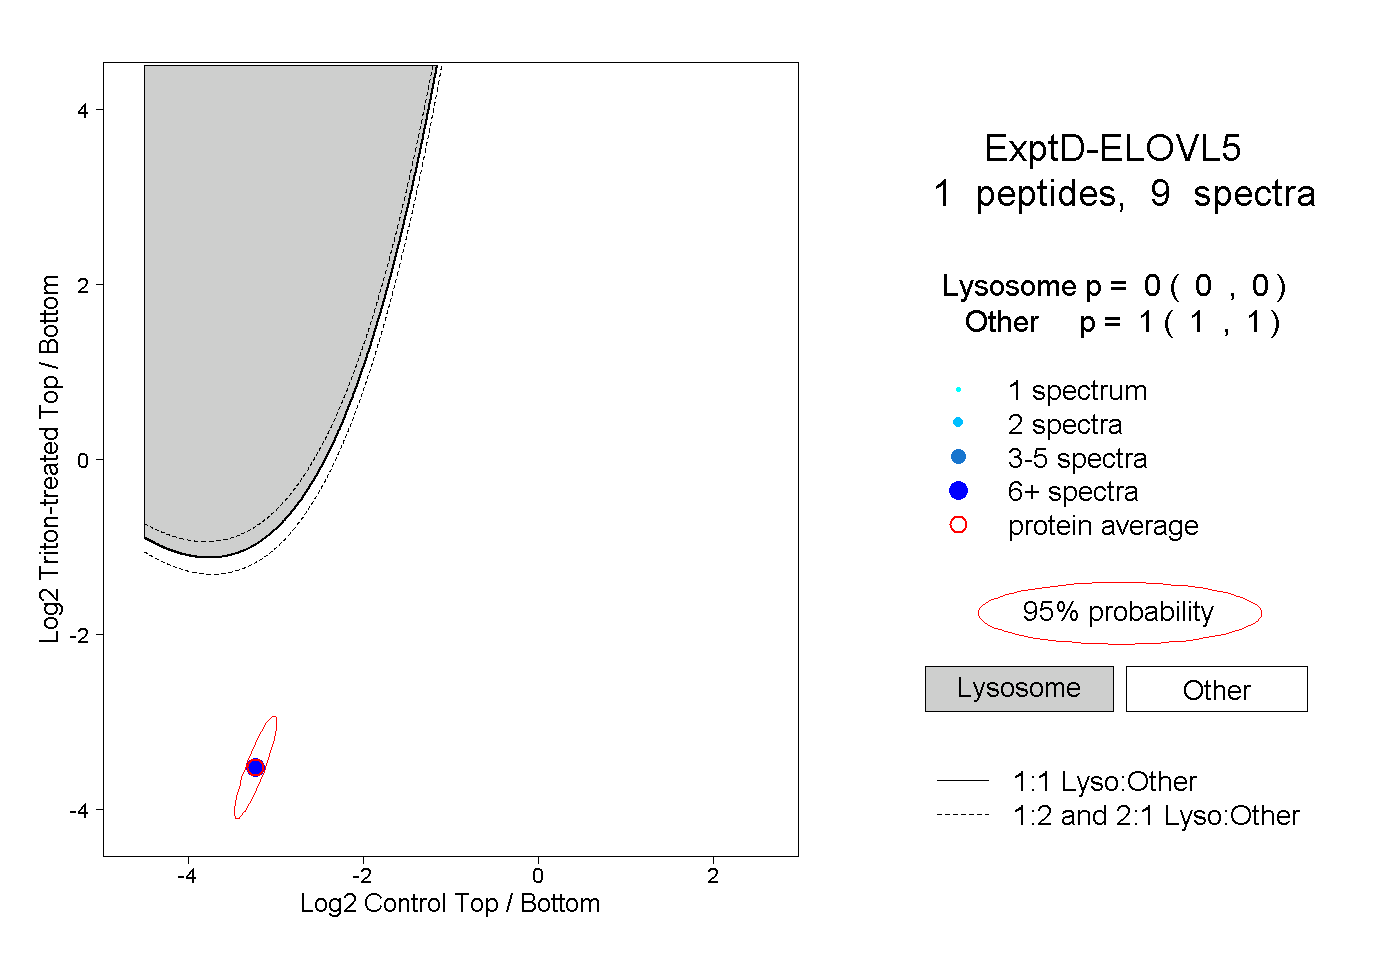
0.000 | 0.000
1.000 | 1.000