 10
10peptides
spectra
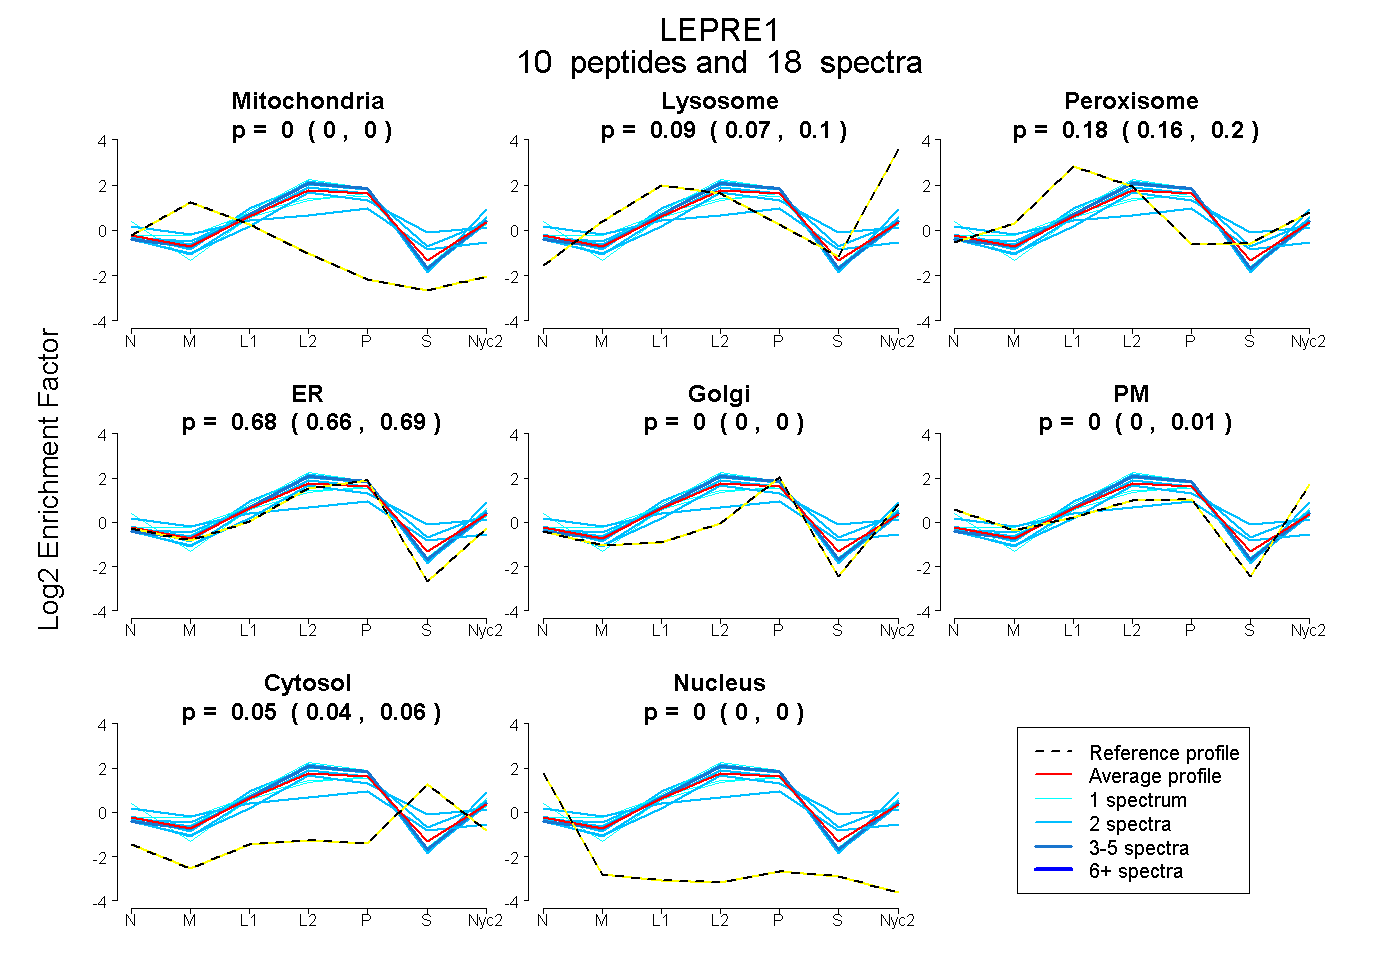
0.000 | 0.000
0.070 | 0.103
0.165 | 0.199
0.662 | 0.694
0.000 | 0.000
0.000 | 0.007
0.037 | 0.056
0.000 | 0.000
2peptides
spectra
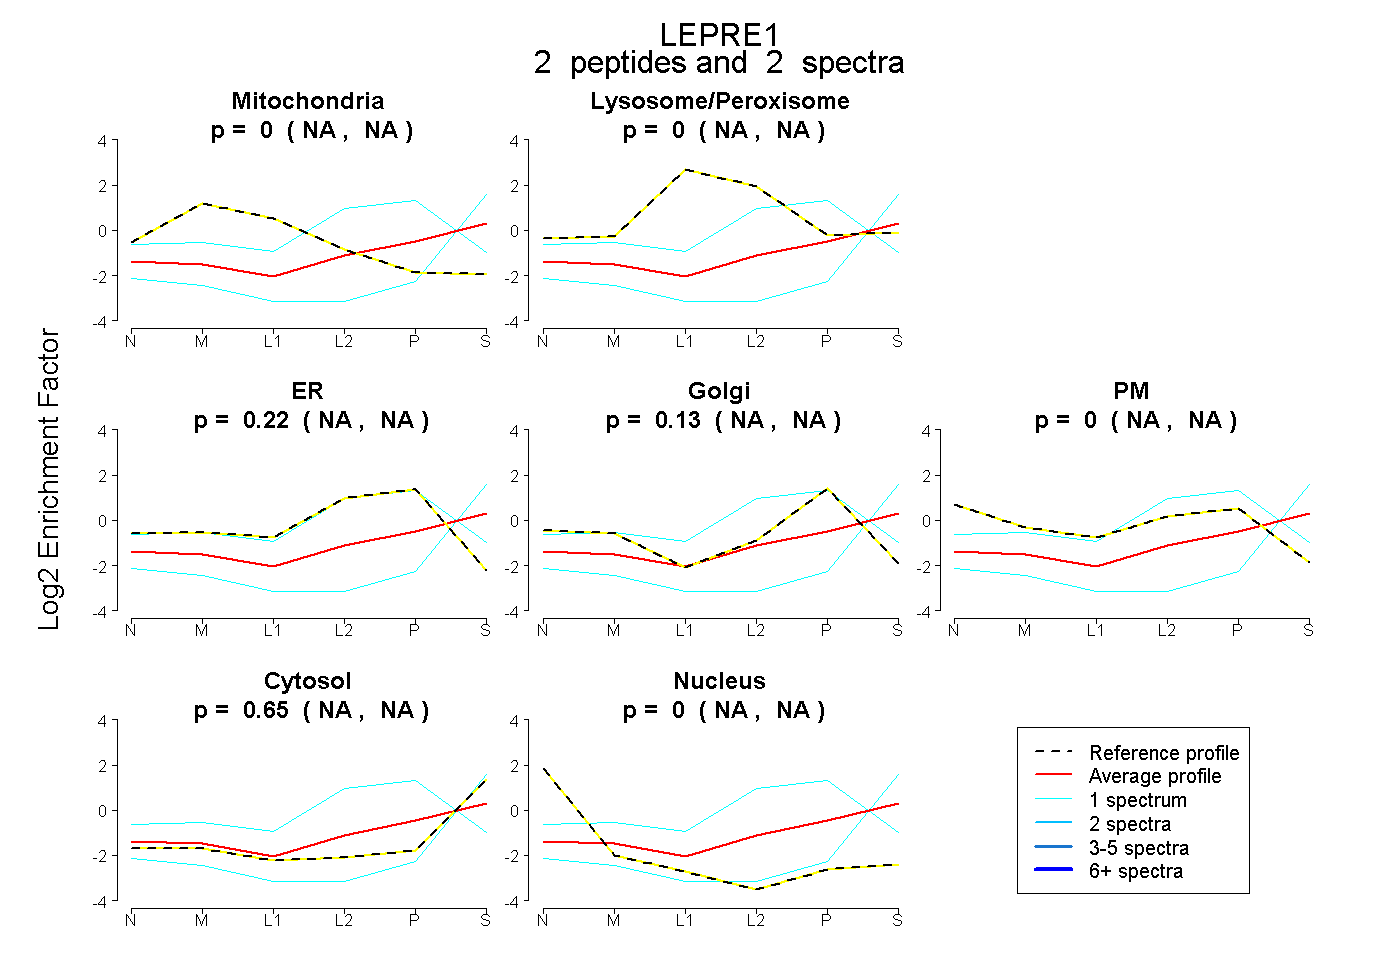
NA | NA
NA | NA
NA | NA
NA | NA
NA | NA
NA | NA
NA | NA
9peptides
spectra
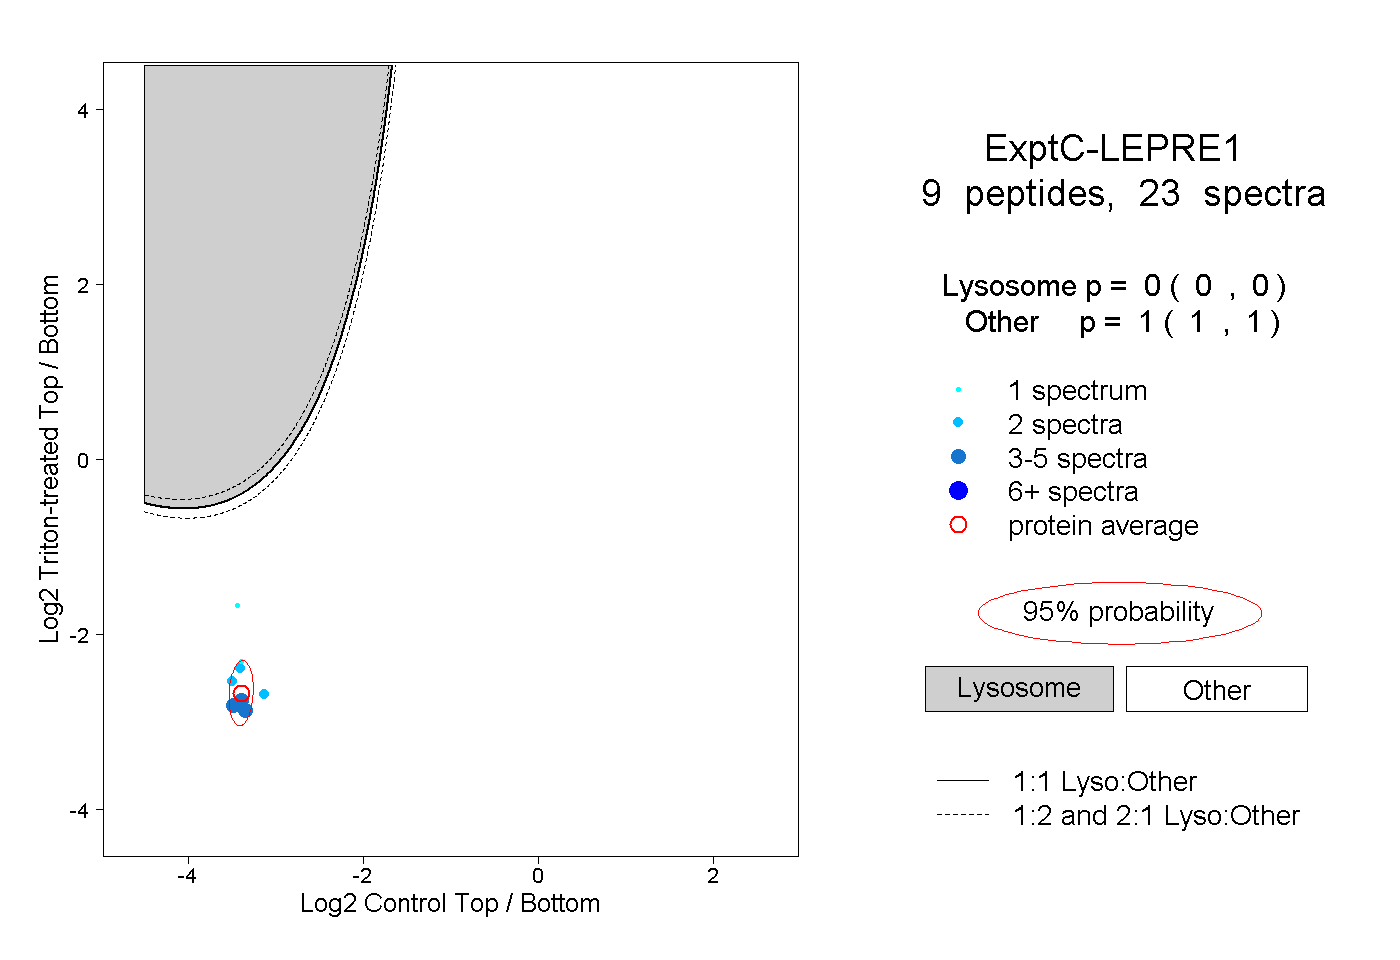
0.000 | 0.000
1.000 | 1.000
4peptides
spectra
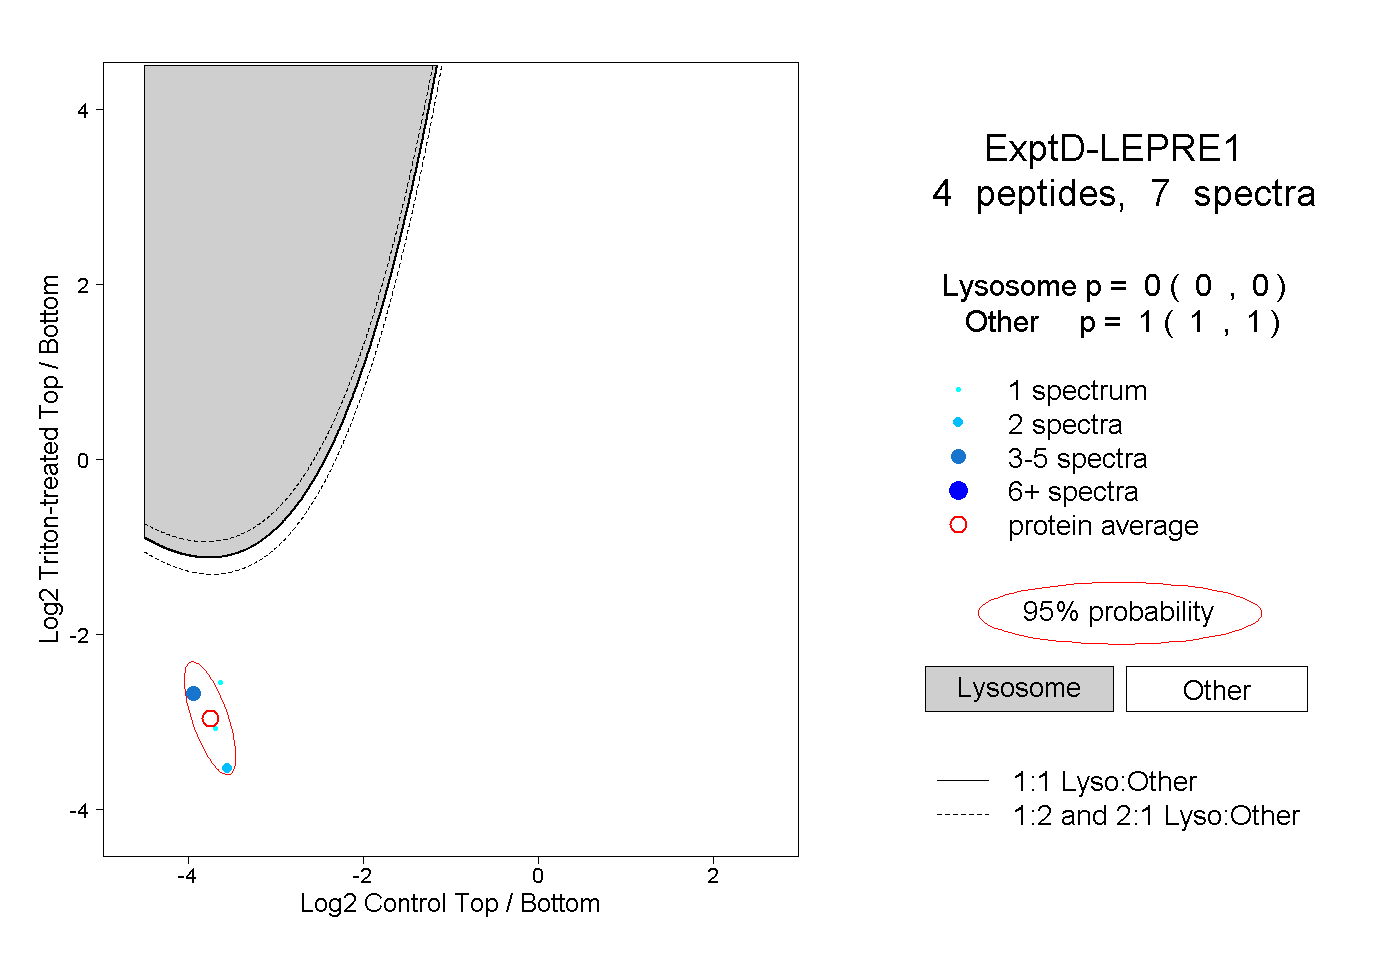
0.000 | 0.000
1.000 | 1.000