 10
10peptides
spectra
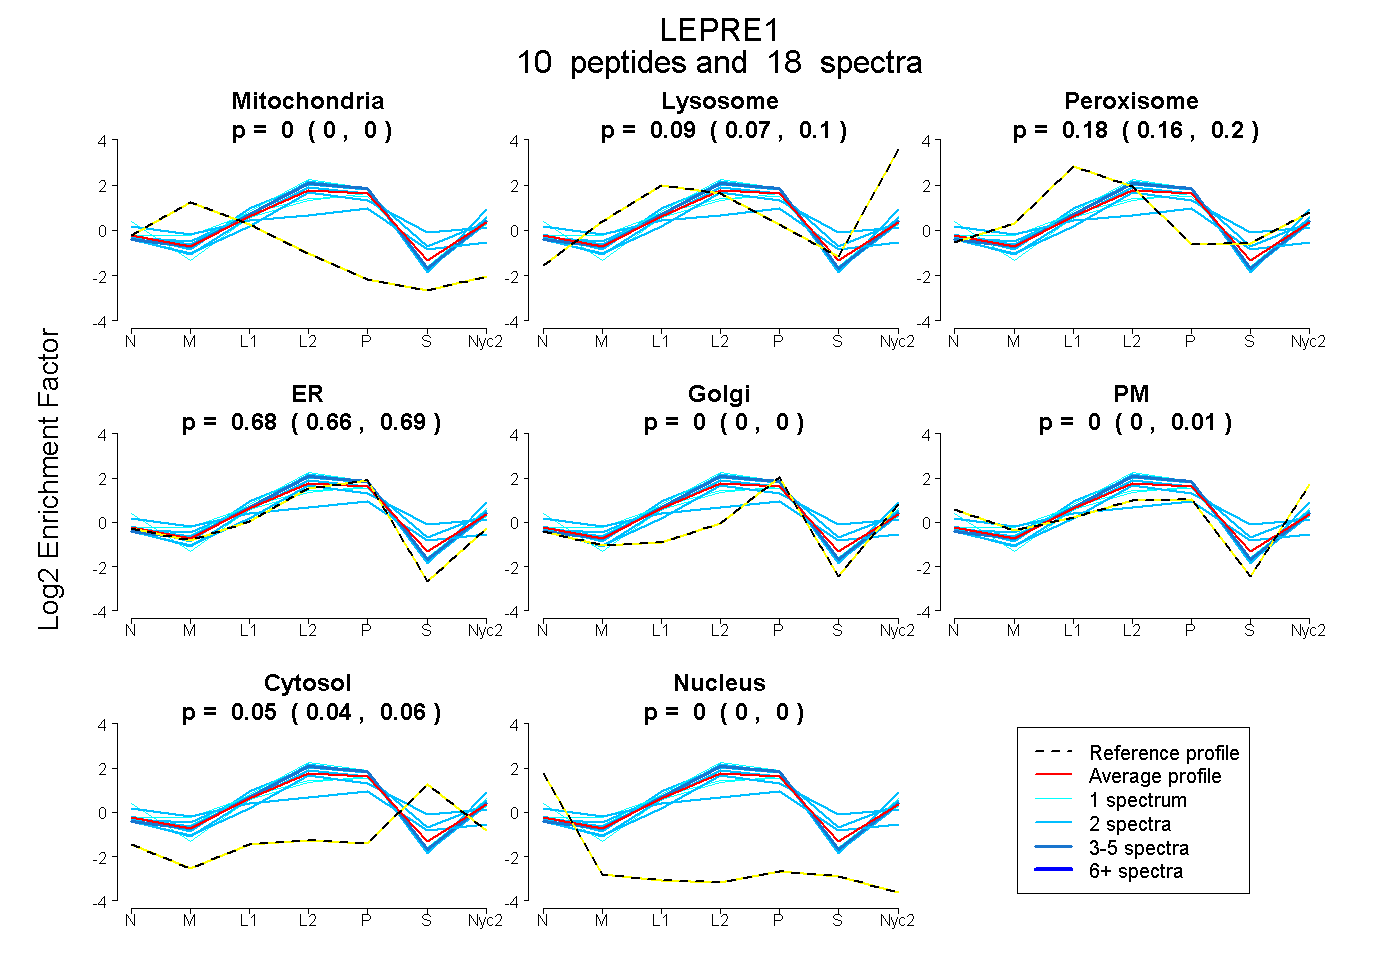
0.000 | 0.000
0.070 | 0.103
0.165 | 0.199
0.662 | 0.694
0.000 | 0.000
0.000 | 0.007
0.037 | 0.056
0.000 | 0.000
| Plot | Mito | Lyso | Perox | ER | Golgi | PM | Cytosol | Nucleus | |||||
| Expt A |
10 peptides |
18 spectra |
|
0.000 0.000 | 0.000 |
0.089 0.070 | 0.103 |
0.183 0.165 | 0.199 |
0.680 0.662 | 0.694 |
0.000 0.000 | 0.000 |
0.000 0.000 | 0.007 |
0.047 0.037 | 0.056 |
0.000 0.000 | 0.000 |
| 1 spectrum, EPPAYTFR | 0.000 | 0.000 | 0.350 | 0.441 | 0.206 | 0.000 | 0.004 | 0.000 | ||
| 2 spectra, ENAQEYR | 0.000 | 0.061 | 0.200 | 0.738 | 0.000 | 0.000 | 0.000 | 0.000 | ||
| 2 spectra, VQADDLVK | 0.083 | 0.000 | 0.232 | 0.468 | 0.047 | 0.000 | 0.169 | 0.000 | ||
| 1 spectrum, ESLDVSR | 0.000 | 0.000 | 0.100 | 0.496 | 0.000 | 0.333 | 0.071 | 0.000 | ||
| 2 spectra, EIETLVEEK | 0.000 | 0.093 | 0.192 | 0.598 | 0.000 | 0.000 | 0.117 | 0.000 | ||
| 1 spectrum, ISQEIGNLMK | 0.000 | 0.189 | 0.093 | 0.718 | 0.000 | 0.000 | 0.000 | 0.000 | ||
| 2 spectra, FYGVTVLK | 0.000 | 0.268 | 0.031 | 0.701 | 0.000 | 0.000 | 0.000 | 0.000 | ||
| 2 spectra, TAIEESQAER | 0.000 | 0.053 | 0.205 | 0.507 | 0.000 | 0.000 | 0.236 | 0.000 | ||
| 3 spectra, TVTAEVQPQCGR | 0.000 | 0.120 | 0.129 | 0.750 | 0.000 | 0.000 | 0.000 | 0.000 | ||
| 2 spectra, LTNAAATSGDGYR | 0.000 | 0.158 | 0.096 | 0.745 | 0.000 | 0.000 | 0.000 | 0.000 |
| Plot | Mito | Lyso or Perox | ER | Golgi | PM | Cytosol | Nucleus | ||||||
| Expt B |
2 peptides |
2 spectra |
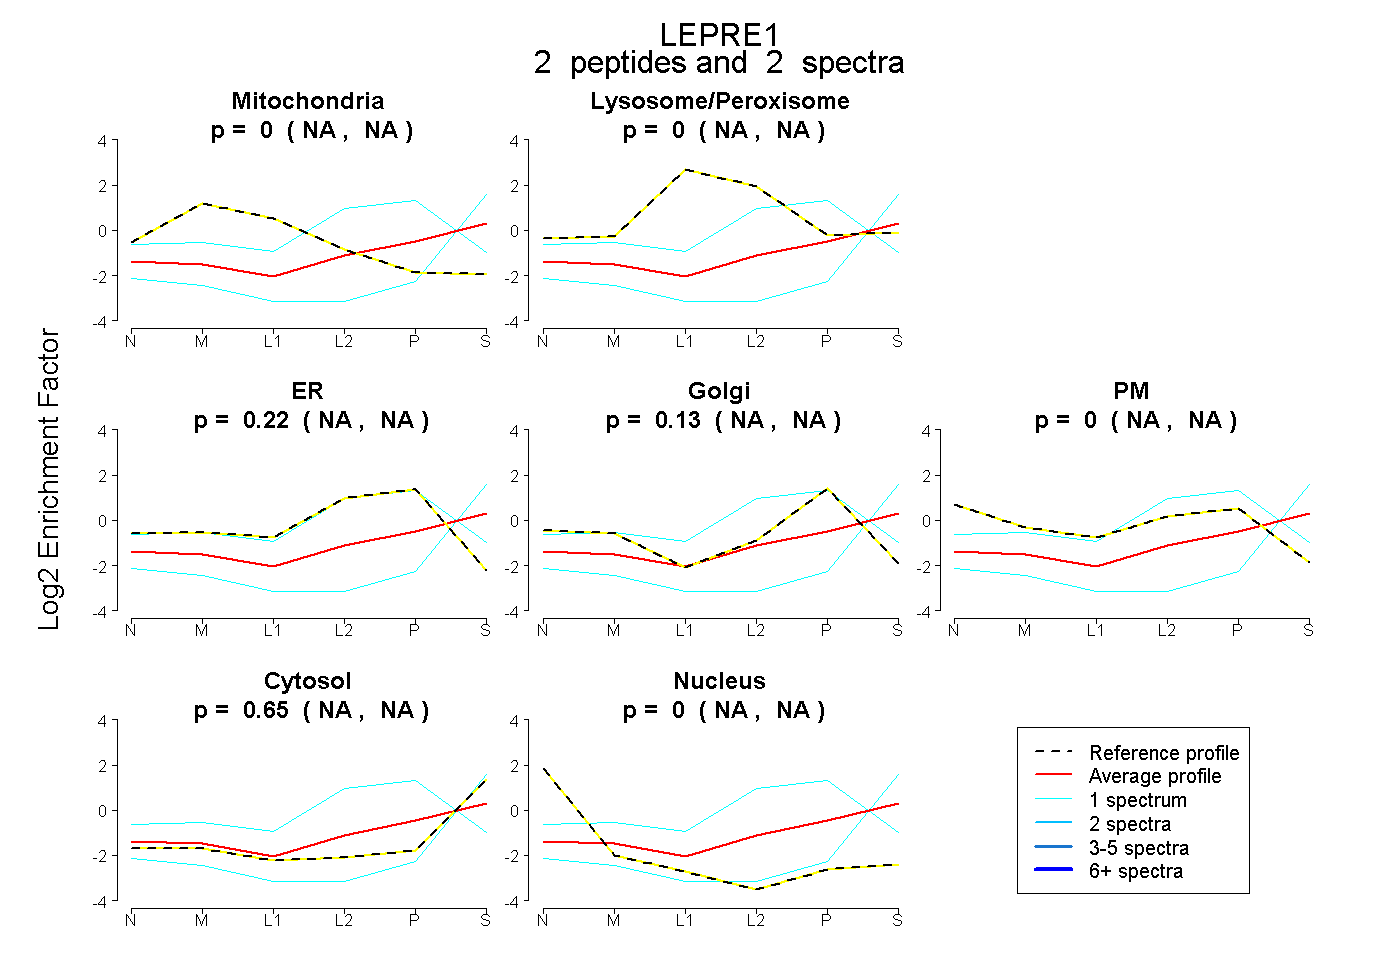 |
0.000 NA | NA |
0.000 NA | NA |
0.223 NA | NA |
0.126 NA | NA |
0.000 NA | NA |
0.651 NA | NA |
0.000 NA | NA |
|||
| Plot | Lyso | Other | |||||||||||
| Expt C |
9 peptides |
23 spectra |
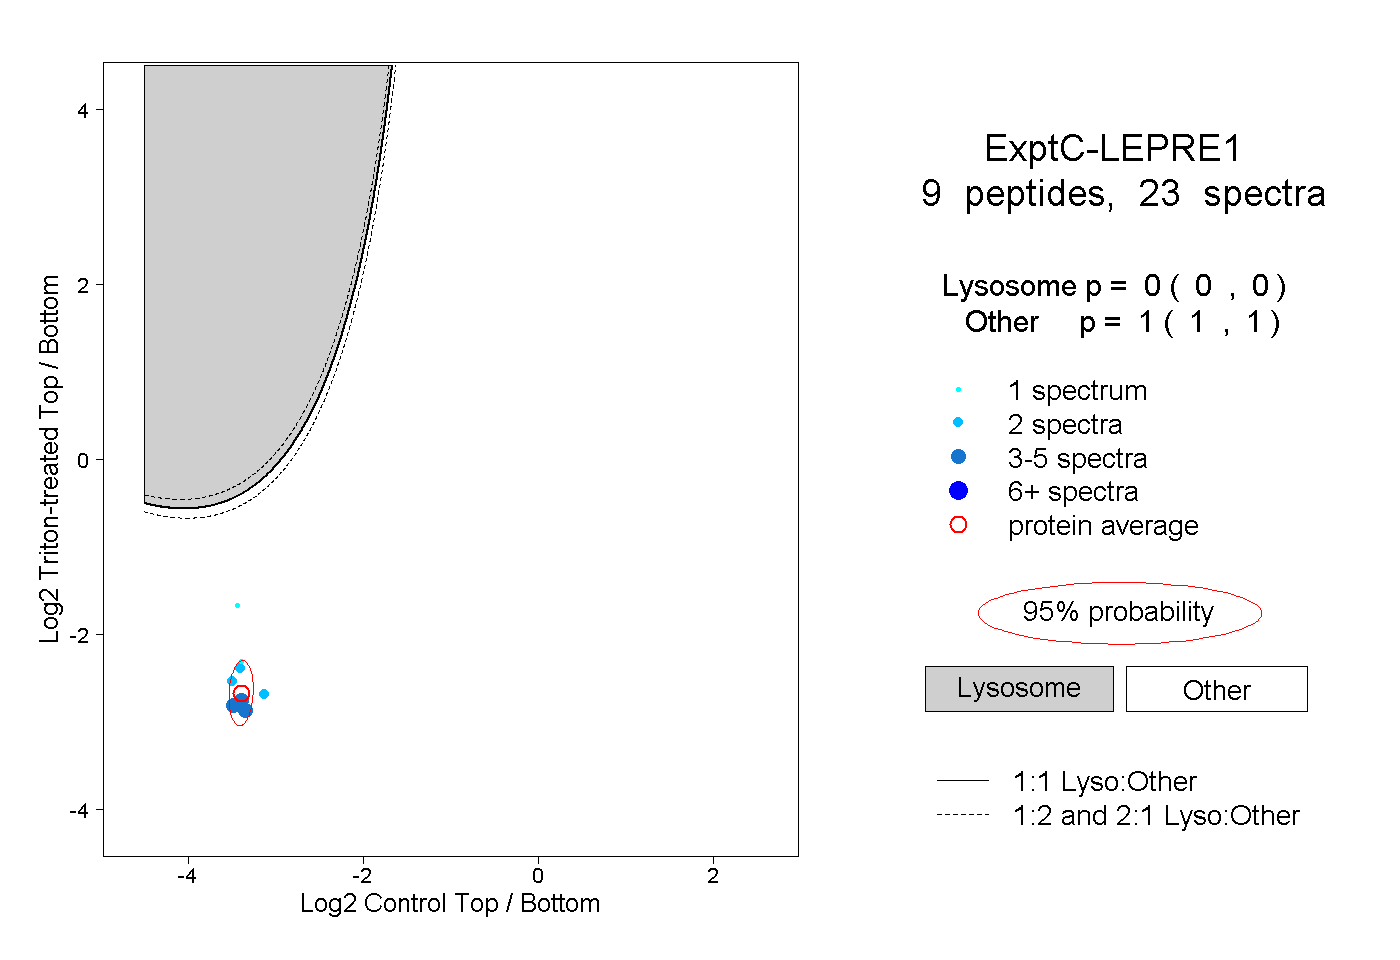 |
0.000 0.000 | 0.000 |
1.000 1.000 | 1.000 |
||||||||
| Plot | Lyso | Other | |||||||||||
| Expt D |
4 peptides |
7 spectra |
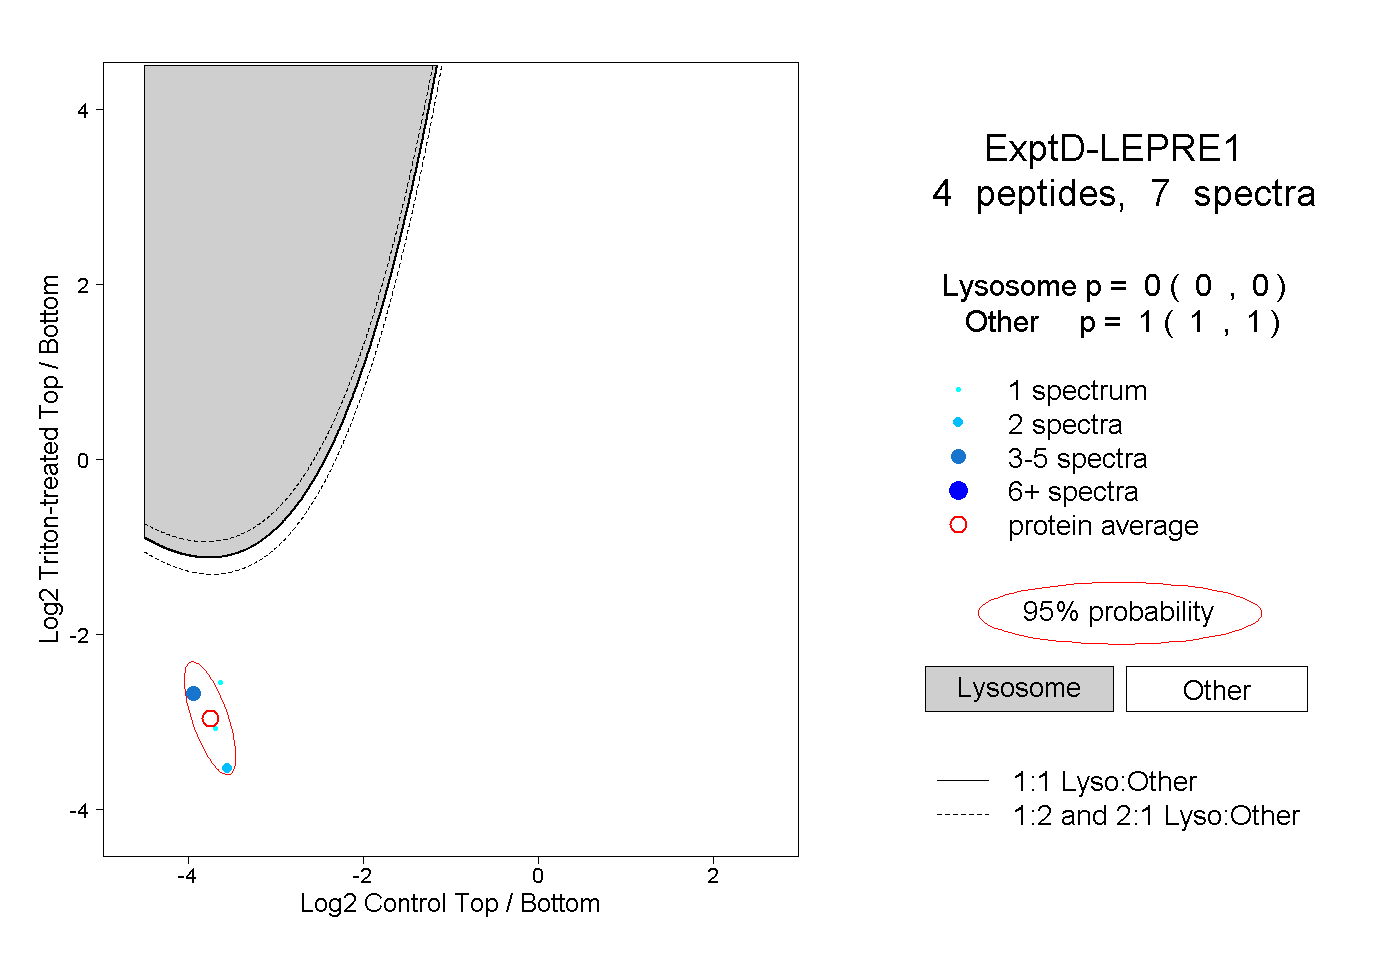 |
0.000 0.000 | 0.000 |
1.000 1.000 | 1.000 |