 11
11peptides
spectra
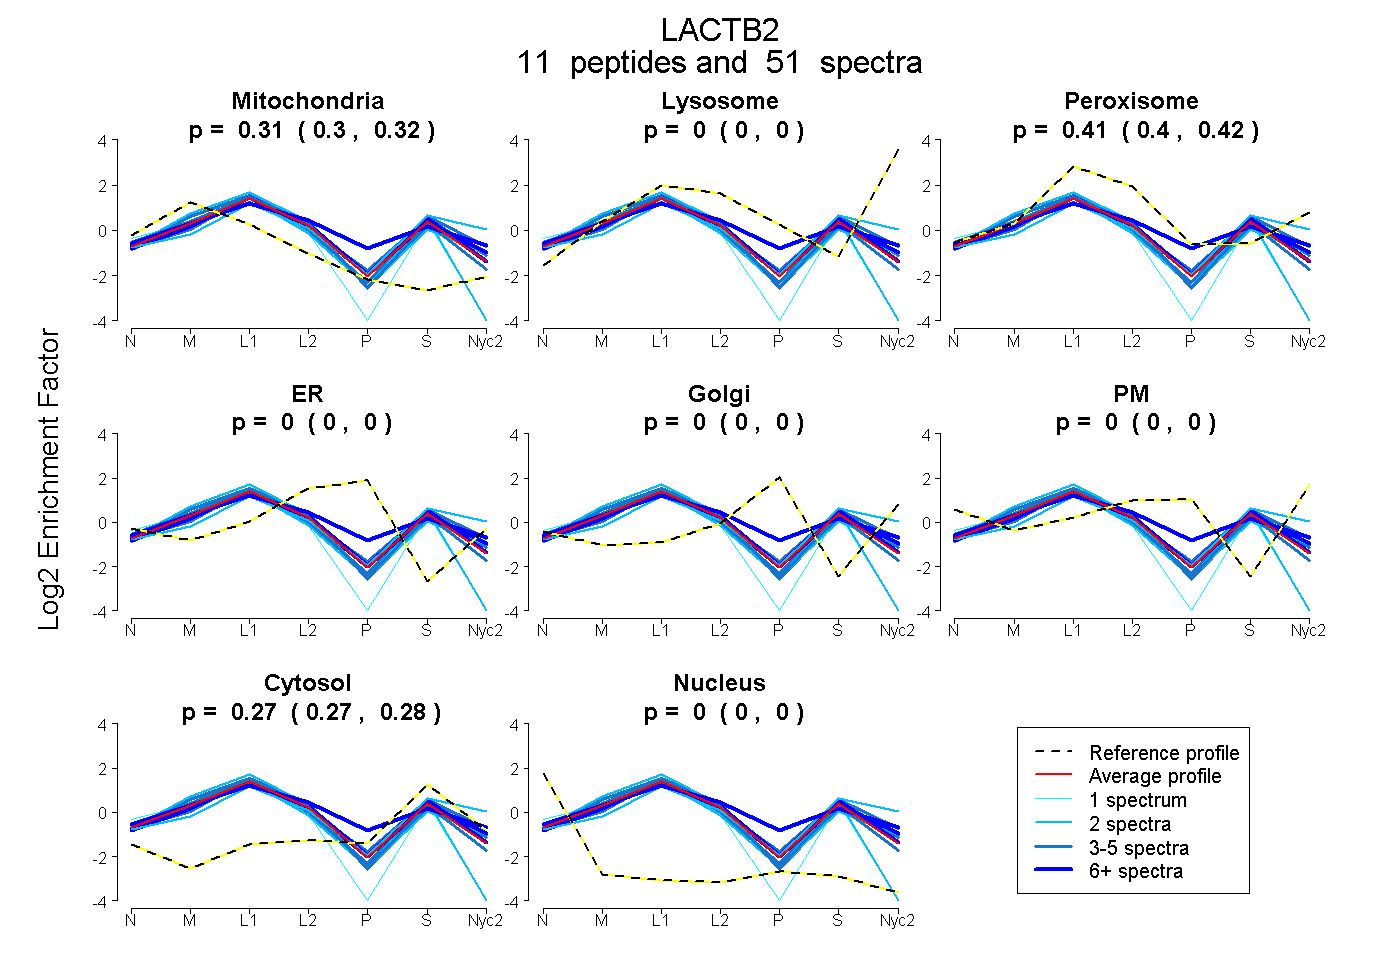
0.305 | 0.322
0.000 | 0.000
0.403 | 0.420
0.000 | 0.000
0.000 | 0.000
0.000 | 0.000
0.271 | 0.276
0.000 | 0.000
10peptides
spectra
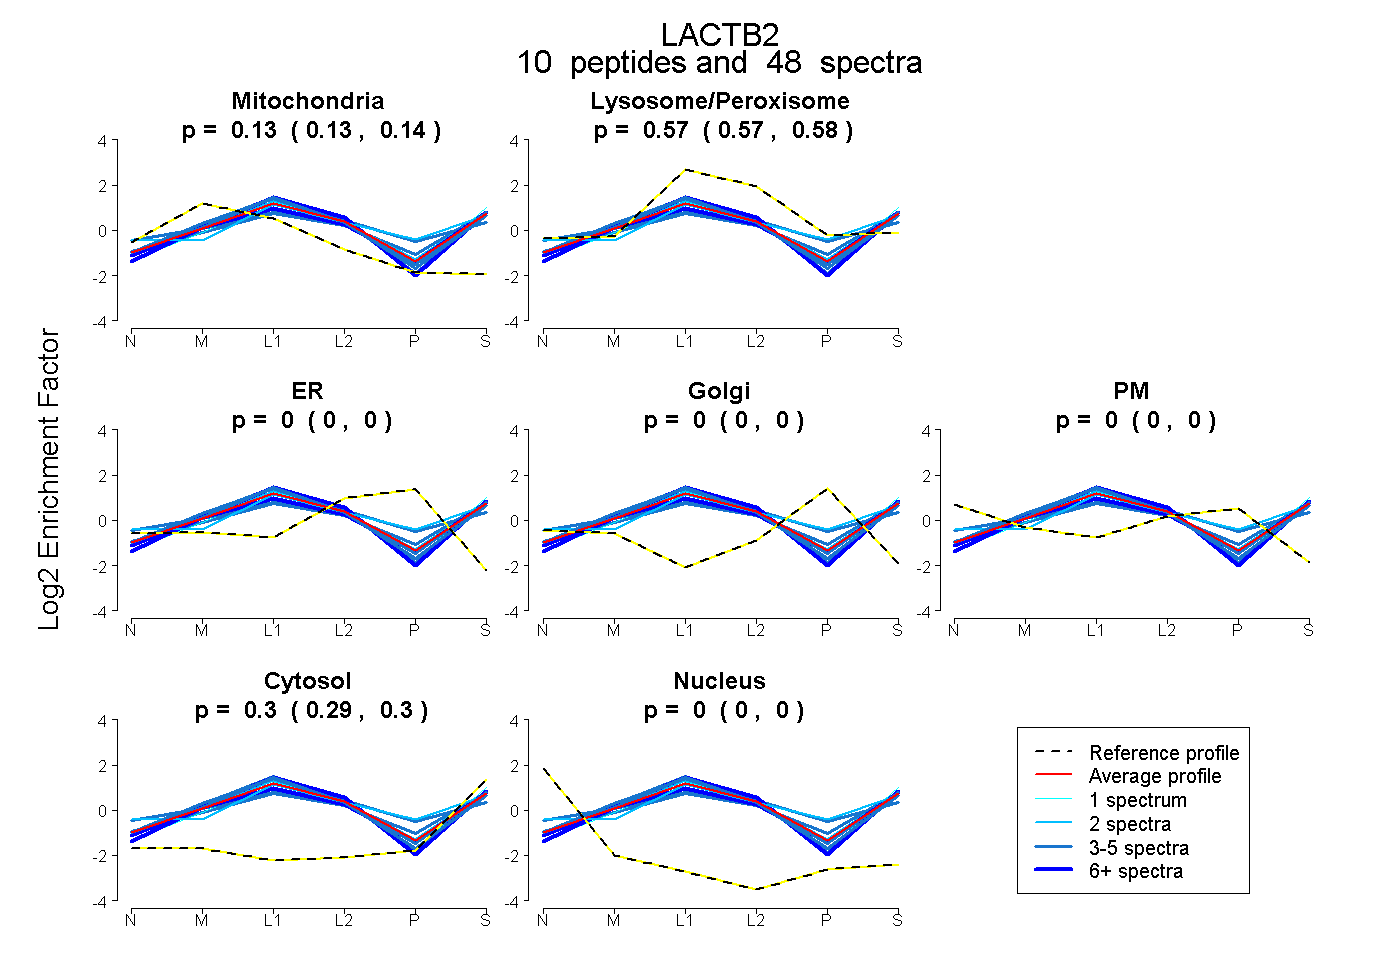
0.125 | 0.136
0.566 | 0.576
0.000 | 0.000
0.000 | 0.000
0.000 | 0.000
0.294 | 0.300
0.000 | 0.000
12peptides
spectra
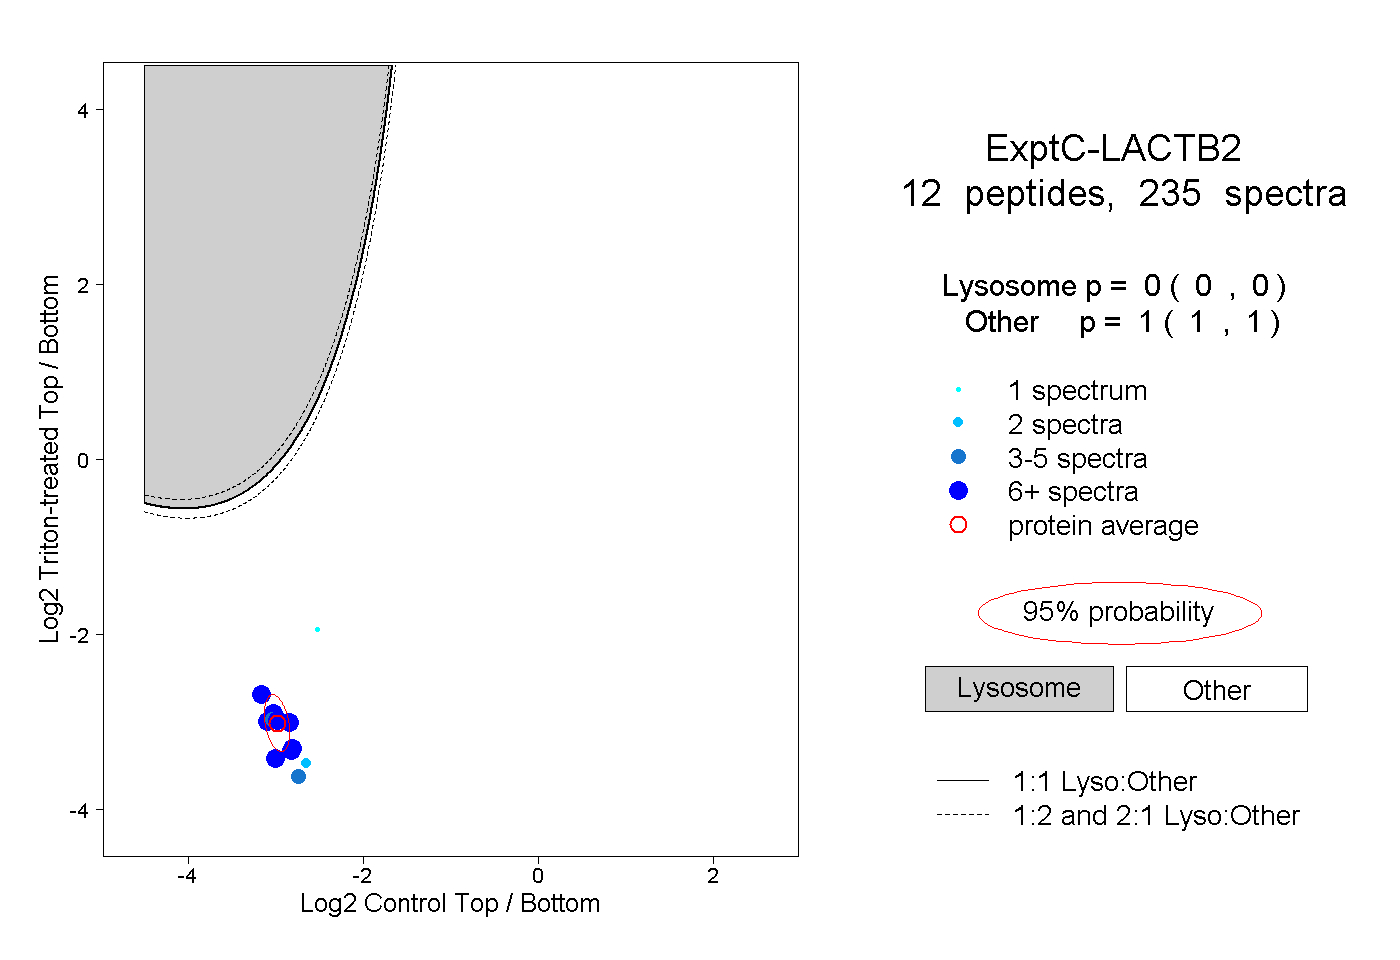
0.000 | 0.000
1.000 | 1.000
7peptides
spectra
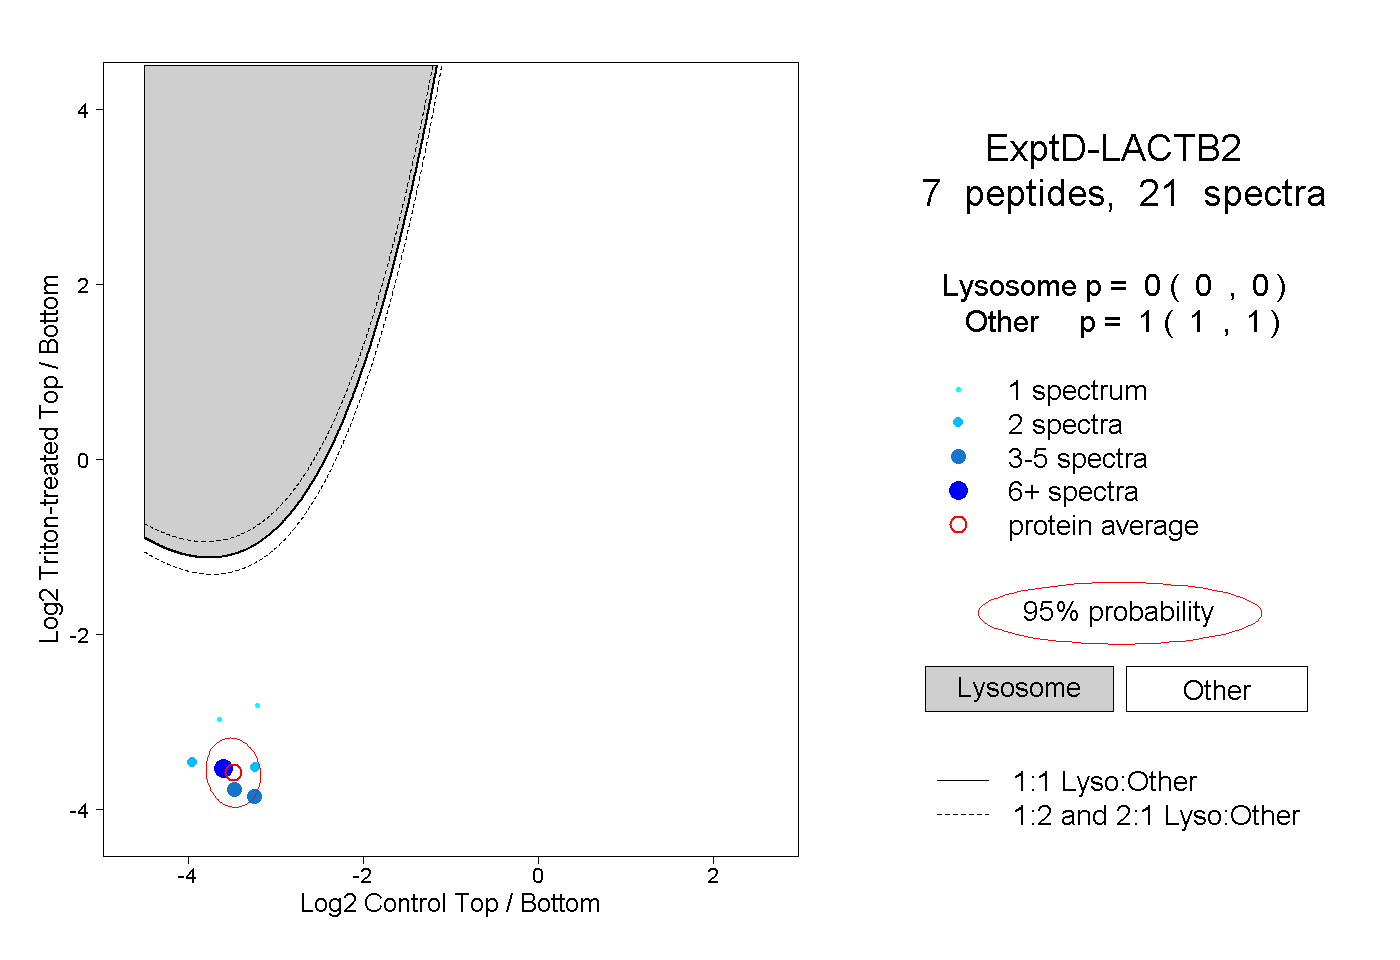
0.000 | 0.000
1.000 | 1.000