 11
11peptides
spectra
0.305 | 0.322
0.000 | 0.000
0.403 | 0.420
0.000 | 0.000
0.000 | 0.000
0.000 | 0.000
0.271 | 0.276
0.000 | 0.000
| Plot | Mito | Lyso | Perox | ER | Golgi | PM | Cytosol | Nucleus | |||||
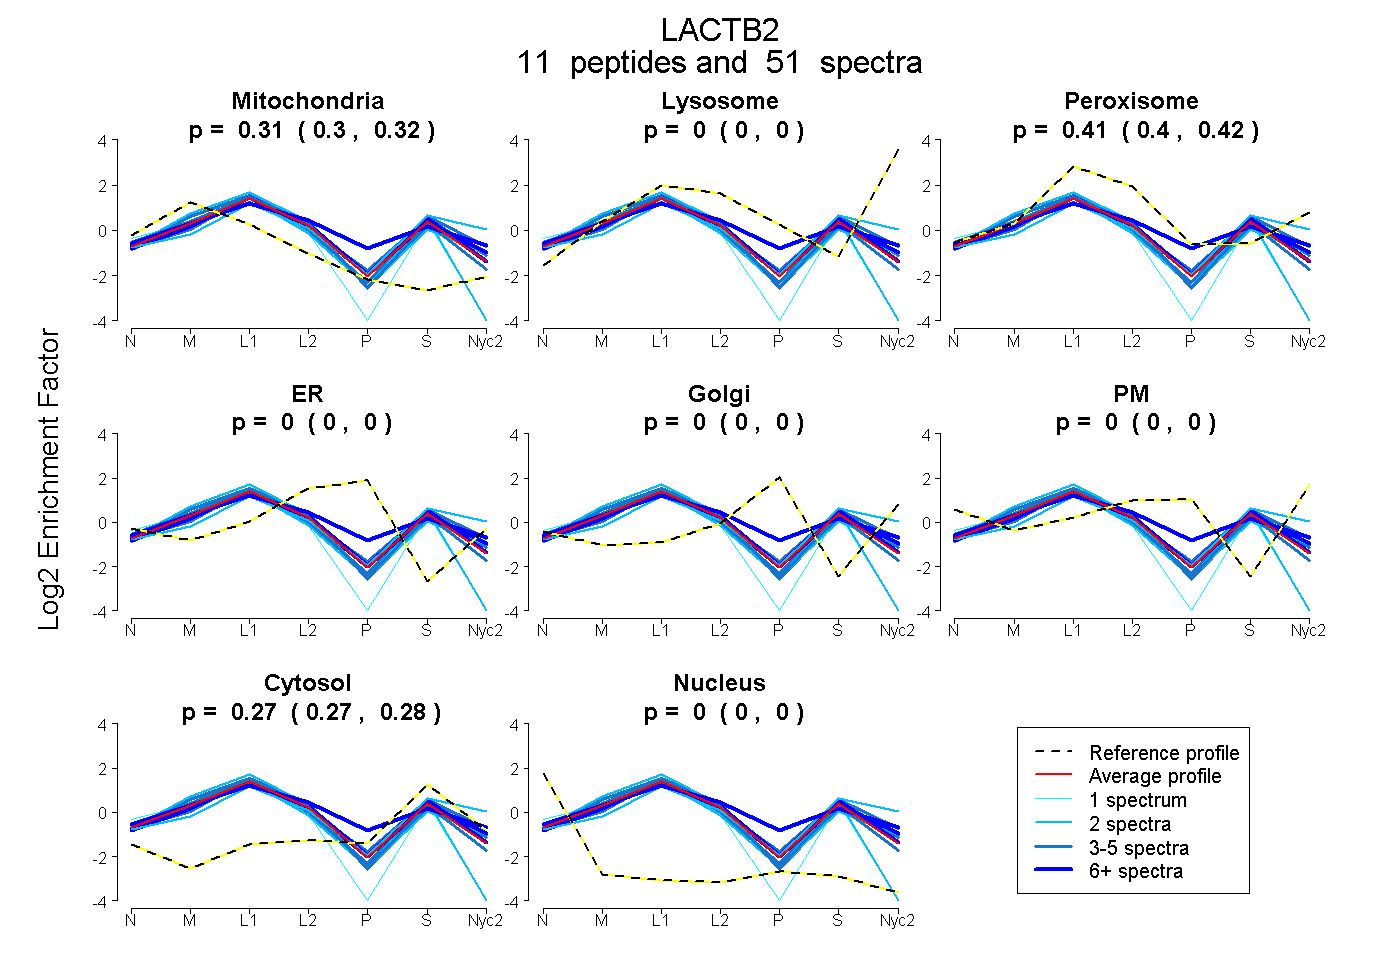
| Expt A |
11 peptides |
51 spectra |
|
0.314 0.305 | 0.322 |
0.000 0.000 | 0.000 |
0.412 0.403 | 0.420 |
0.000 0.000 | 0.000 |
0.000 0.000 | 0.000 |
0.000 0.000 | 0.000 |
0.274 0.271 | 0.276 |
0.000 0.000 | 0.000 |
| 3 spectra, ANIIYPGHGPVIHNAEAK | 0.227 | 0.000 | 0.454 | 0.000 | 0.000 | 0.000 | 0.320 | 0.000 | ||
| 2 spectra, IFSIASPAK | 0.372 | 0.000 | 0.467 | 0.000 | 0.000 | 0.000 | 0.162 | 0.000 | ||
| 2 spectra, QALAEFDTAIQEILVTHWHR | 0.112 | 0.000 | 0.506 | 0.000 | 0.000 | 0.000 | 0.383 | 0.000 | ||
| 1 spectrum, DHSGGIVDICK | 0.702 | 0.000 | 0.064 | 0.000 | 0.000 | 0.000 | 0.234 | 0.000 | ||
| 7 spectra, MAEHNLLLHLR | 0.266 | 0.000 | 0.433 | 0.000 | 0.000 | 0.000 | 0.301 | 0.000 | ||
| 2 spectra, DNLEESFSVSELR | 0.579 | 0.000 | 0.122 | 0.000 | 0.000 | 0.000 | 0.300 | 0.000 | ||
| 16 spectra, ILEYISHR | 0.278 | 0.000 | 0.453 | 0.000 | 0.000 | 0.000 | 0.269 | 0.000 | ||
| 4 spectra, EEQIITVFR | 0.264 | 0.000 | 0.418 | 0.000 | 0.000 | 0.000 | 0.318 | 0.000 | ||
| 4 spectra, IEQLSSR | 0.348 | 0.000 | 0.449 | 0.000 | 0.000 | 0.000 | 0.204 | 0.000 | ||
| 7 spectra, TEGATLR | 0.201 | 0.000 | 0.531 | 0.000 | 0.000 | 0.000 | 0.268 | 0.000 | ||
| 3 spectra, NISNDATYCIK | 0.389 | 0.000 | 0.372 | 0.000 | 0.000 | 0.000 | 0.239 | 0.000 |
| Plot | Mito | Lyso or Perox | ER | Golgi | PM | Cytosol | Nucleus | ||||||
| Expt B |
10 peptides |
48 spectra |
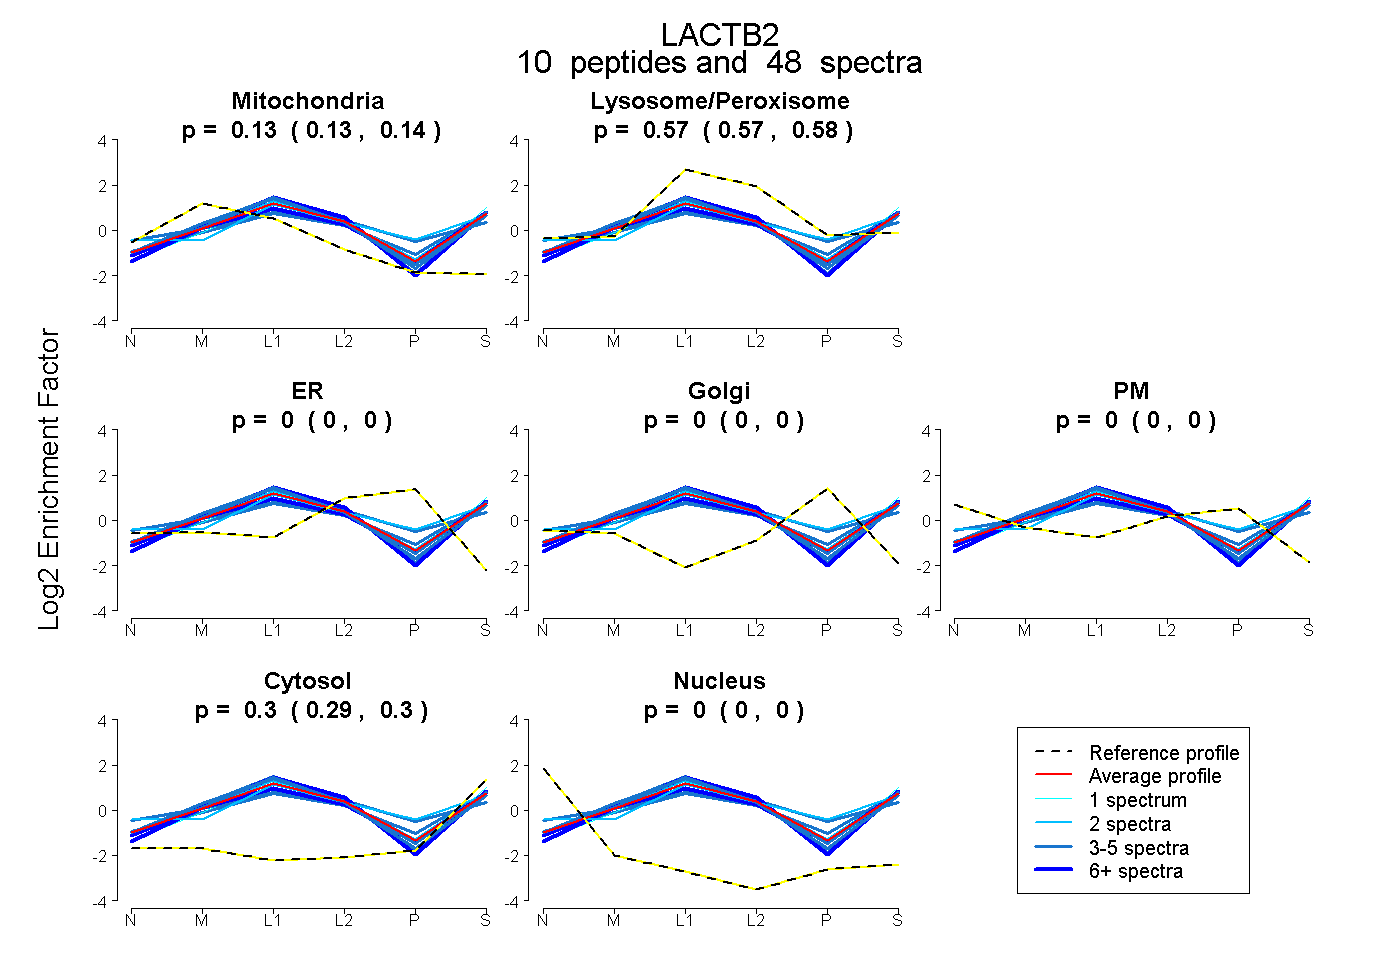 |
0.131 0.125 | 0.136 |
0.572 0.566 | 0.576 |
0.000 0.000 | 0.000 |
0.000 0.000 | 0.000 |
0.000 0.000 | 0.000 |
0.297 0.294 | 0.300 |
0.000 0.000 | 0.000 |
|||
| Plot | Lyso | Other | |||||||||||
| Expt C |
12 peptides |
235 spectra |
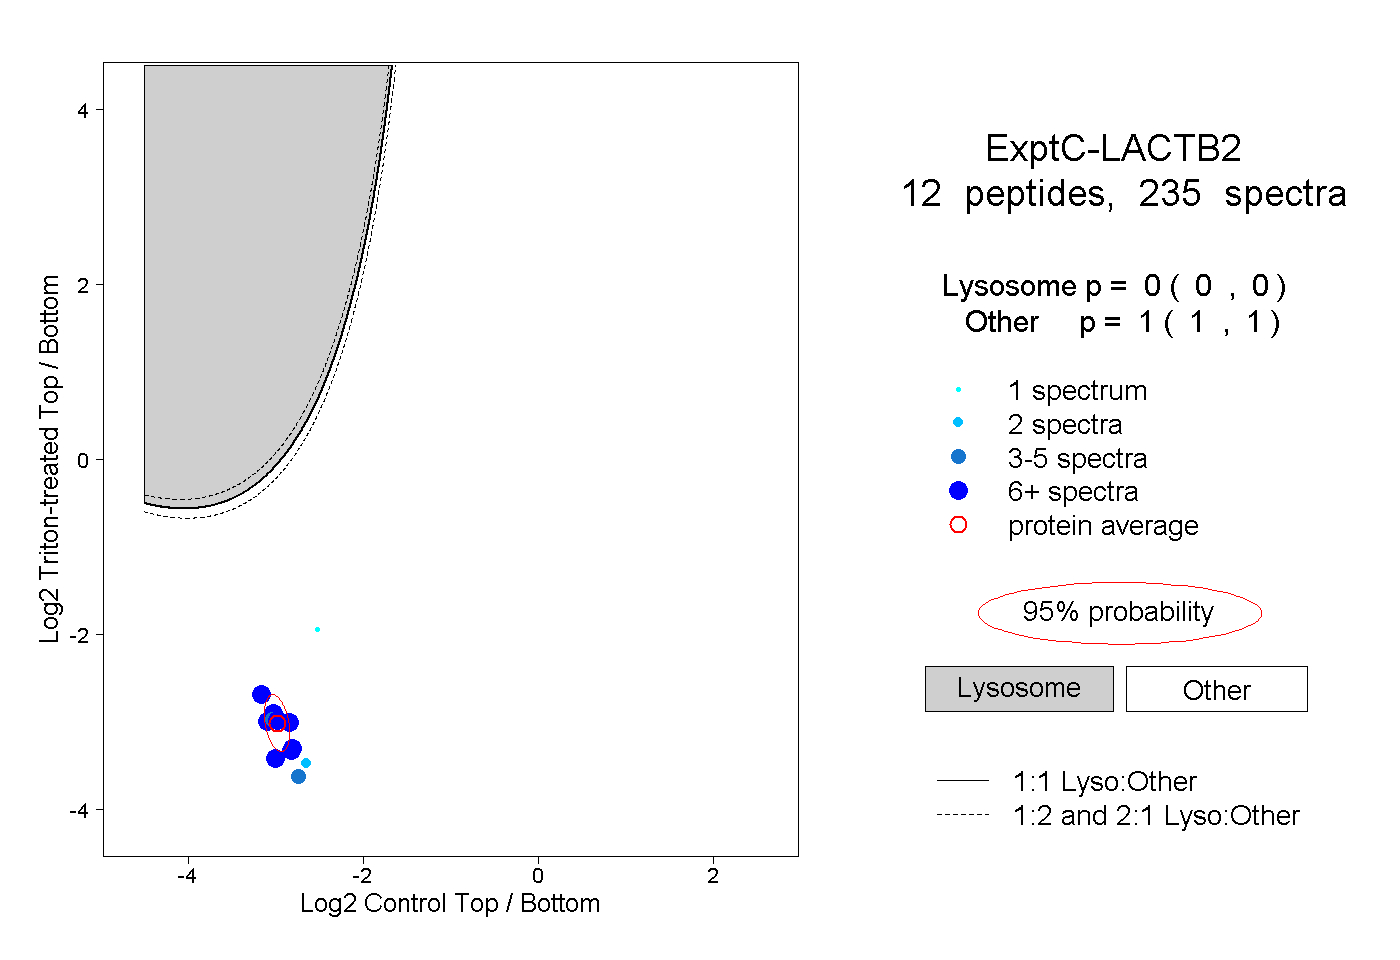 |
0.000 0.000 | 0.000 |
1.000 1.000 | 1.000 |
||||||||
| Plot | Lyso | Other | |||||||||||
| Expt D |
7 peptides |
21 spectra |
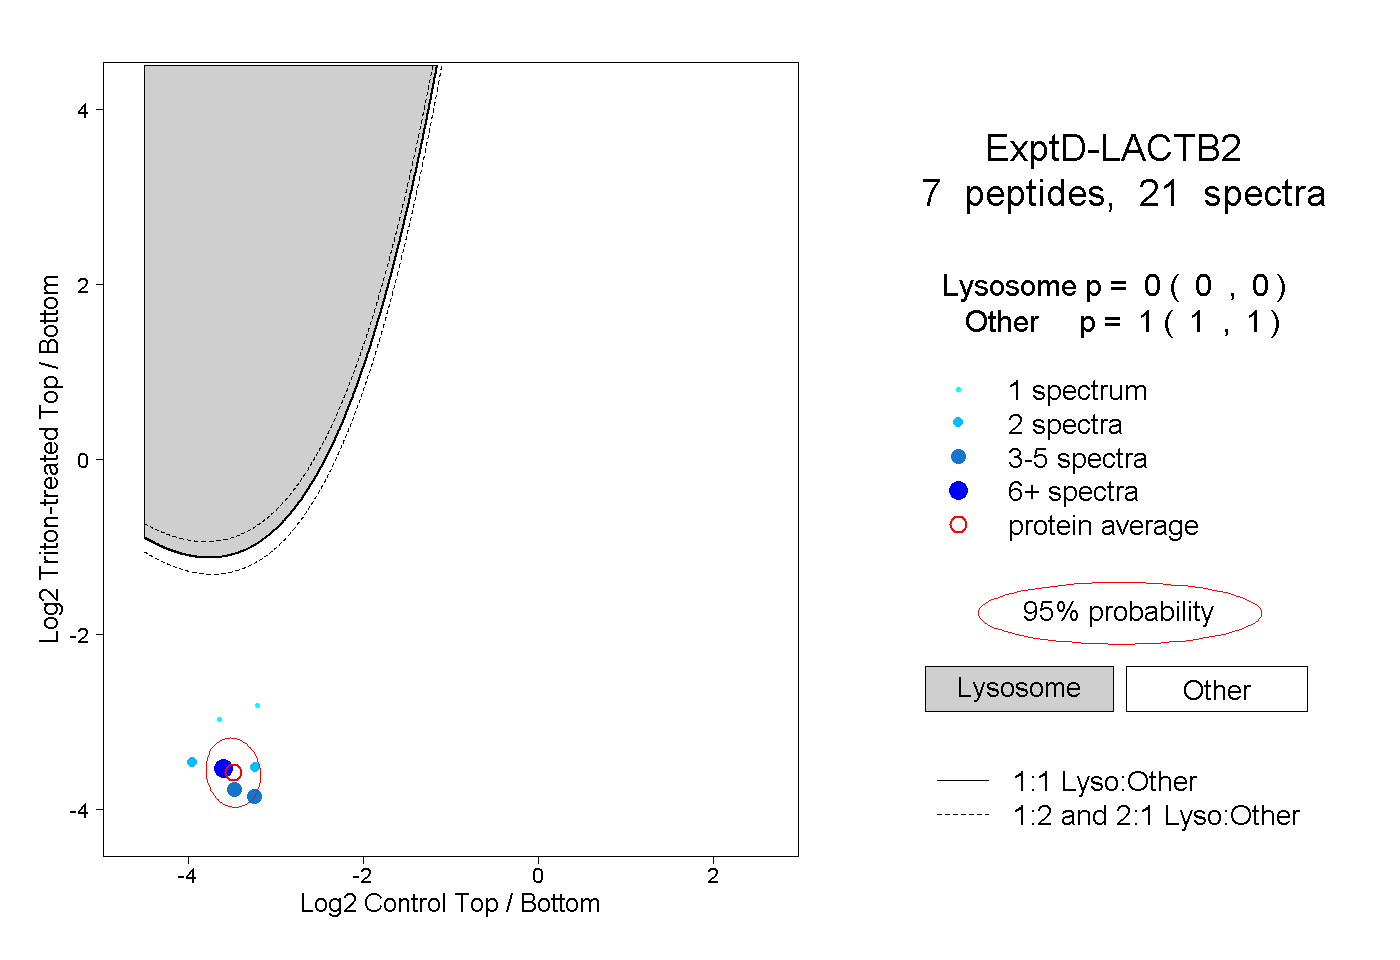 |
0.000 0.000 | 0.000 |
1.000 1.000 | 1.000 |