 7
7peptides
spectra
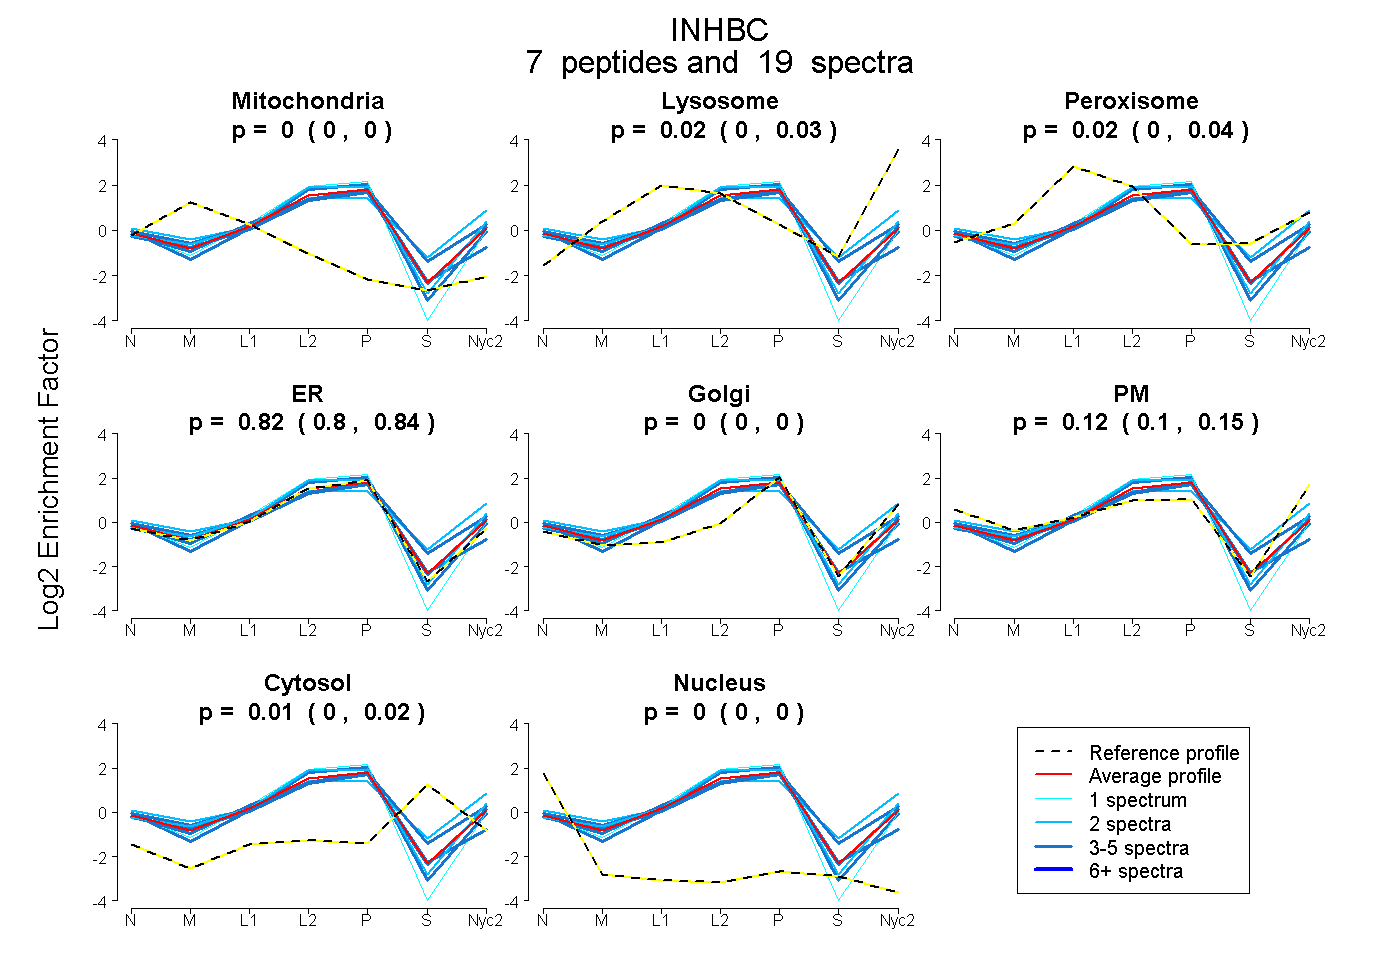
0.000 | 0.000
0.000 | 0.034
0.004 | 0.041
0.795 | 0.842
0.000 | 0.000
0.099 | 0.145
0.000 | 0.024
0.000 | 0.000
1peptide
spectra
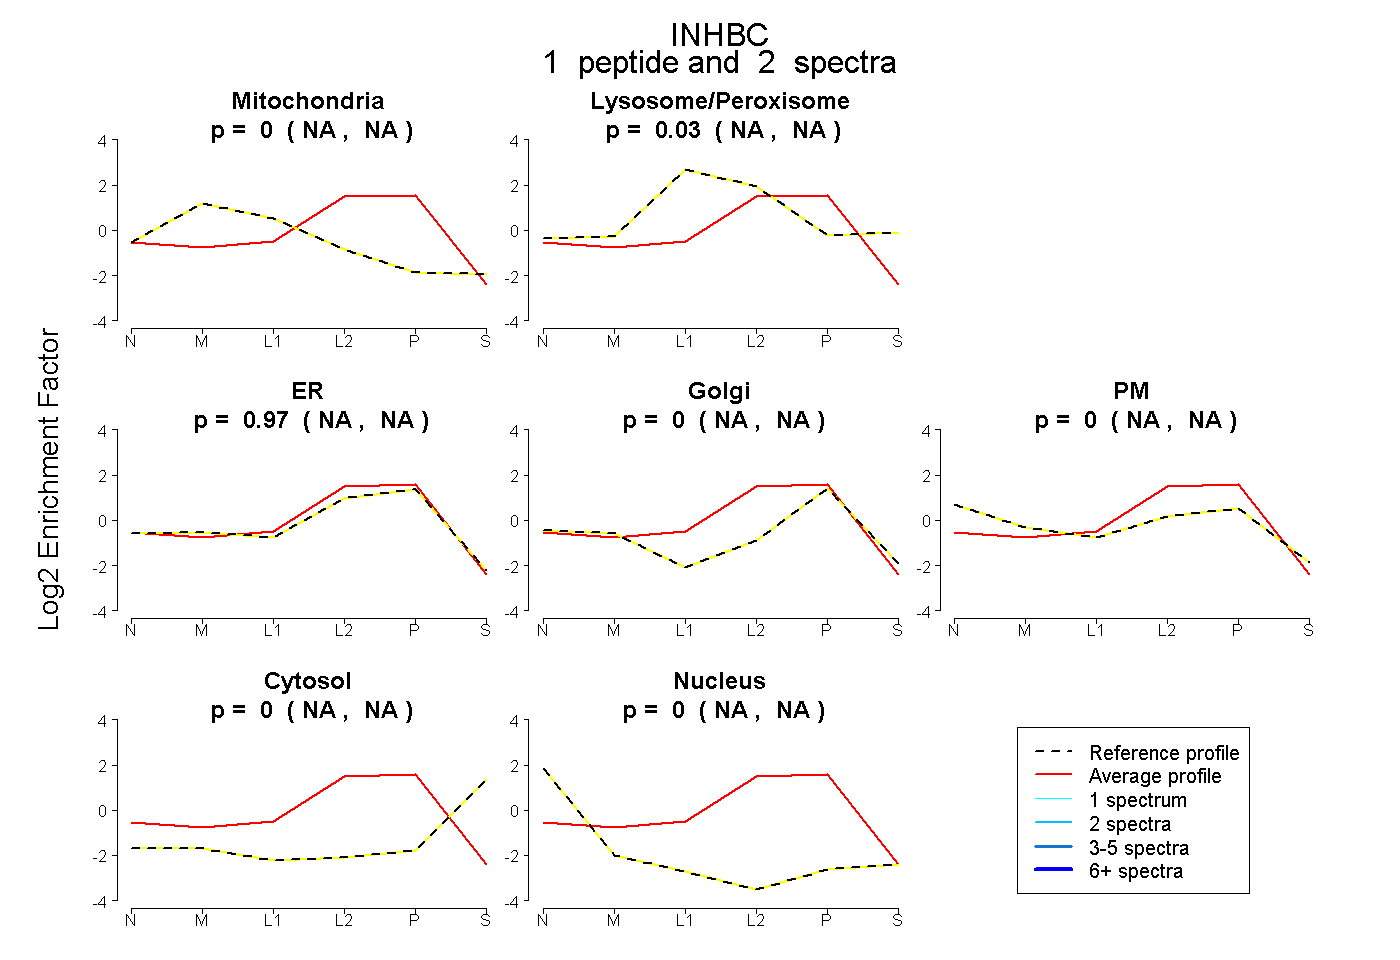
NA | NA
NA | NA
NA | NA
NA | NA
NA | NA
NA | NA
NA | NA
7peptides
spectra
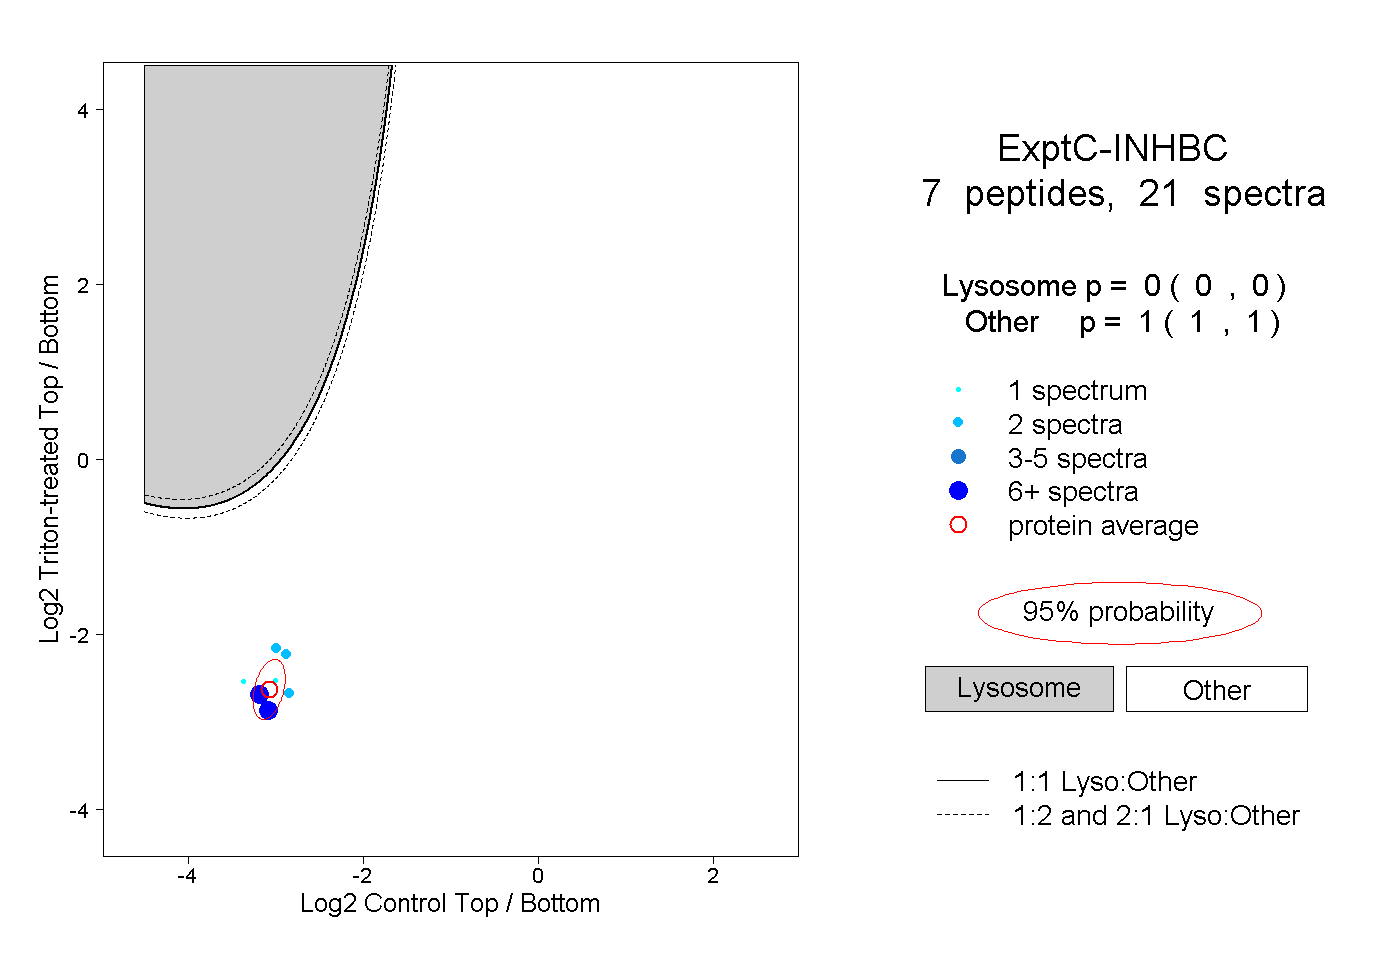
0.000 | 0.000
1.000 | 1.000
3peptides
spectra
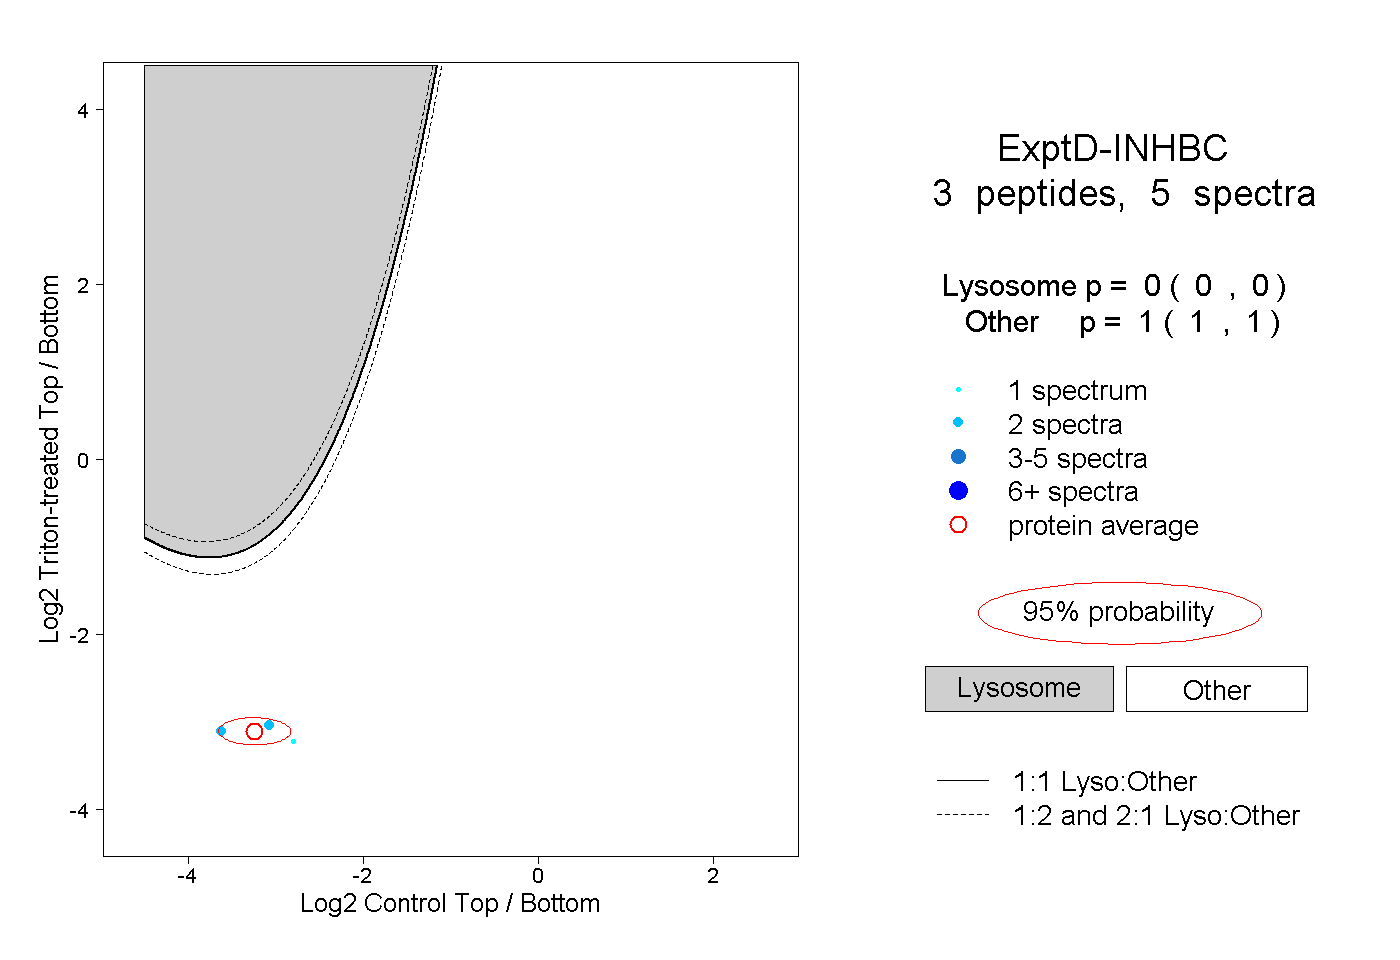
0.000 | 0.000
1.000 | 1.000