 6
6peptides
spectra
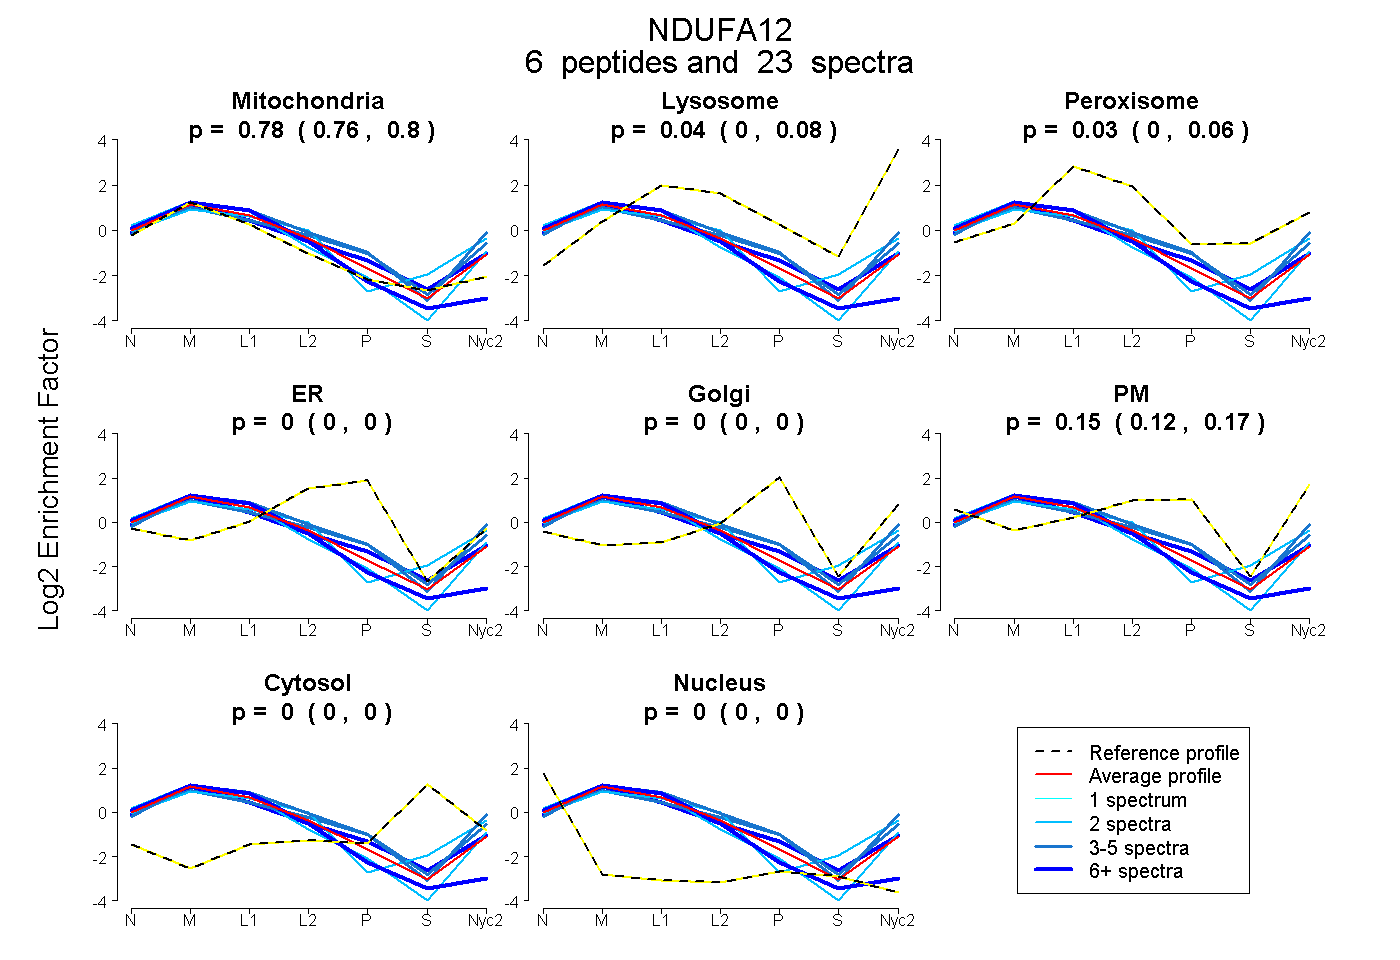
0.764 | 0.798
0.000 | 0.078
0.000 | 0.059
0.000 | 0.000
0.000 | 0.000
0.124 | 0.169
0.000 | 0.000
0.000 | 0.000
3peptides
spectra
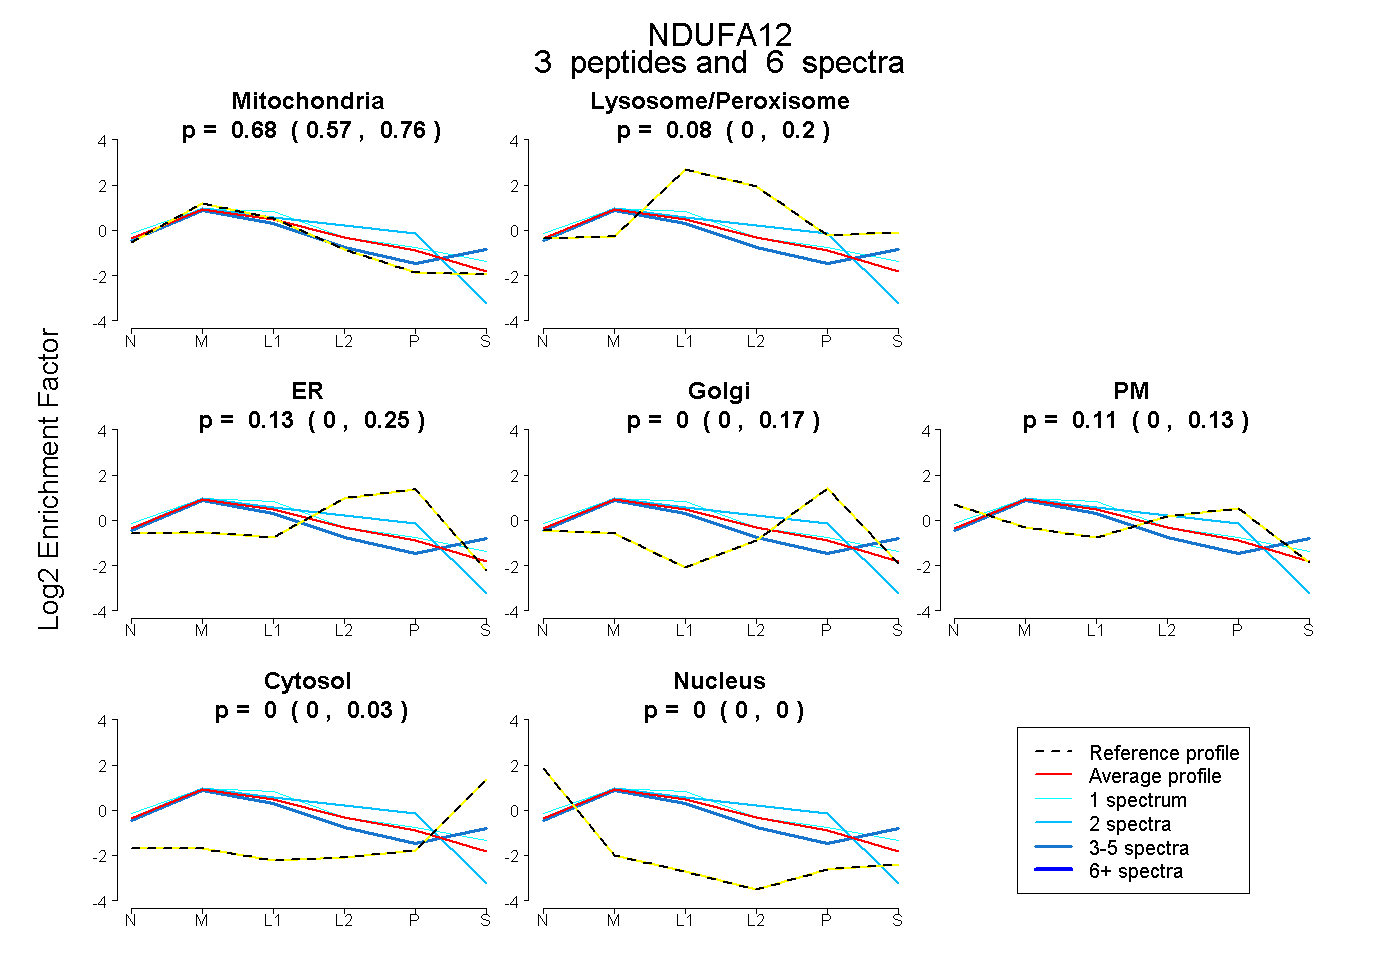
0.573 | 0.759
0.000 | 0.195
0.000 | 0.253
0.000 | 0.167
0.000 | 0.133
0.000 | 0.027
0.000 | 0.000
7peptides
spectra
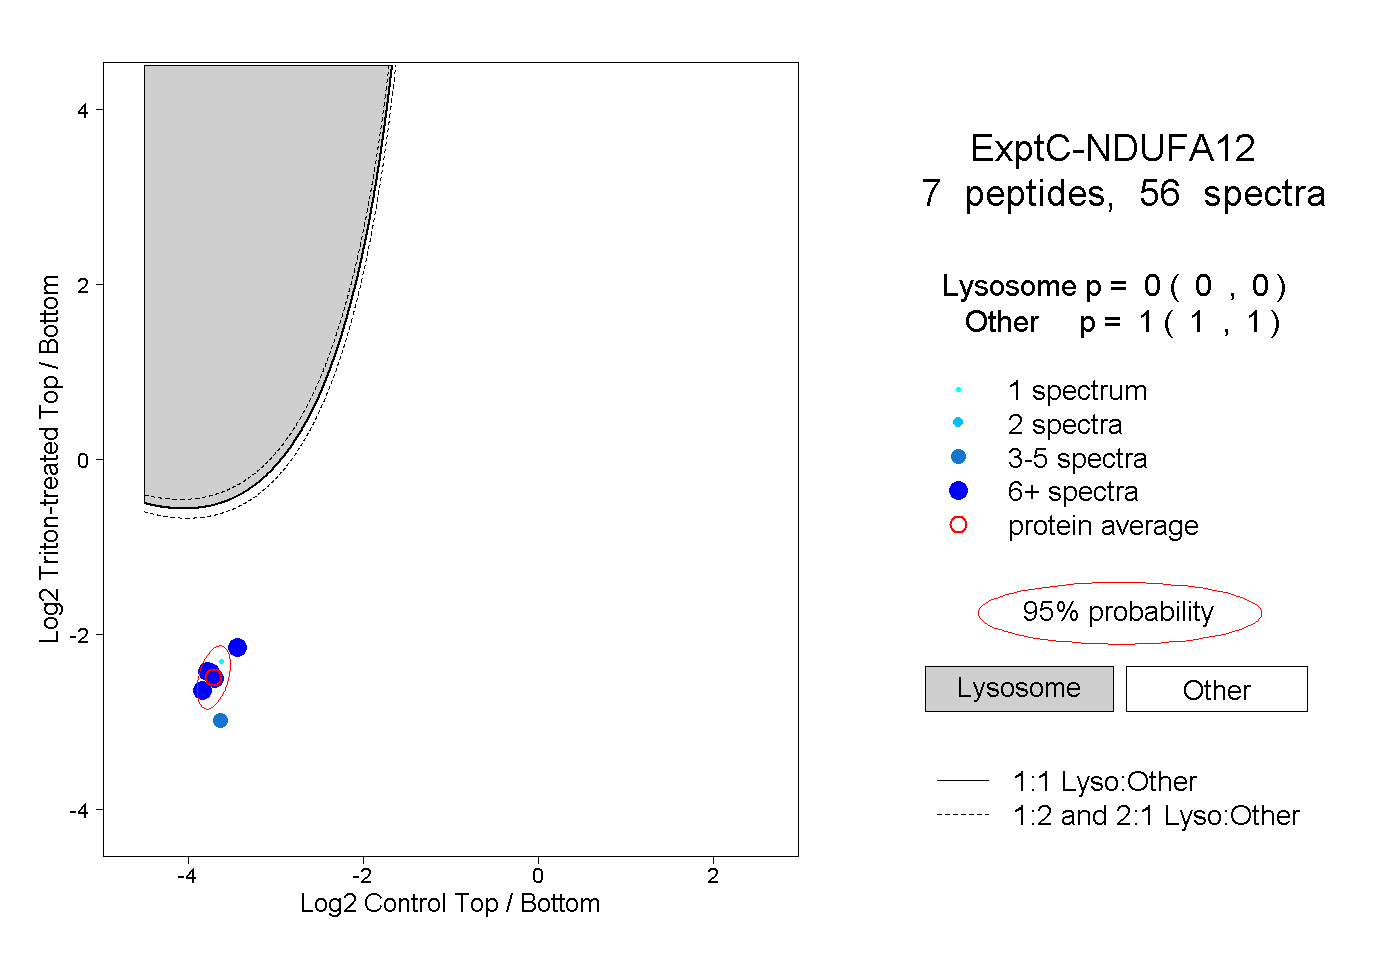
0.000 | 0.000
1.000 | 1.000
1peptide
spectra
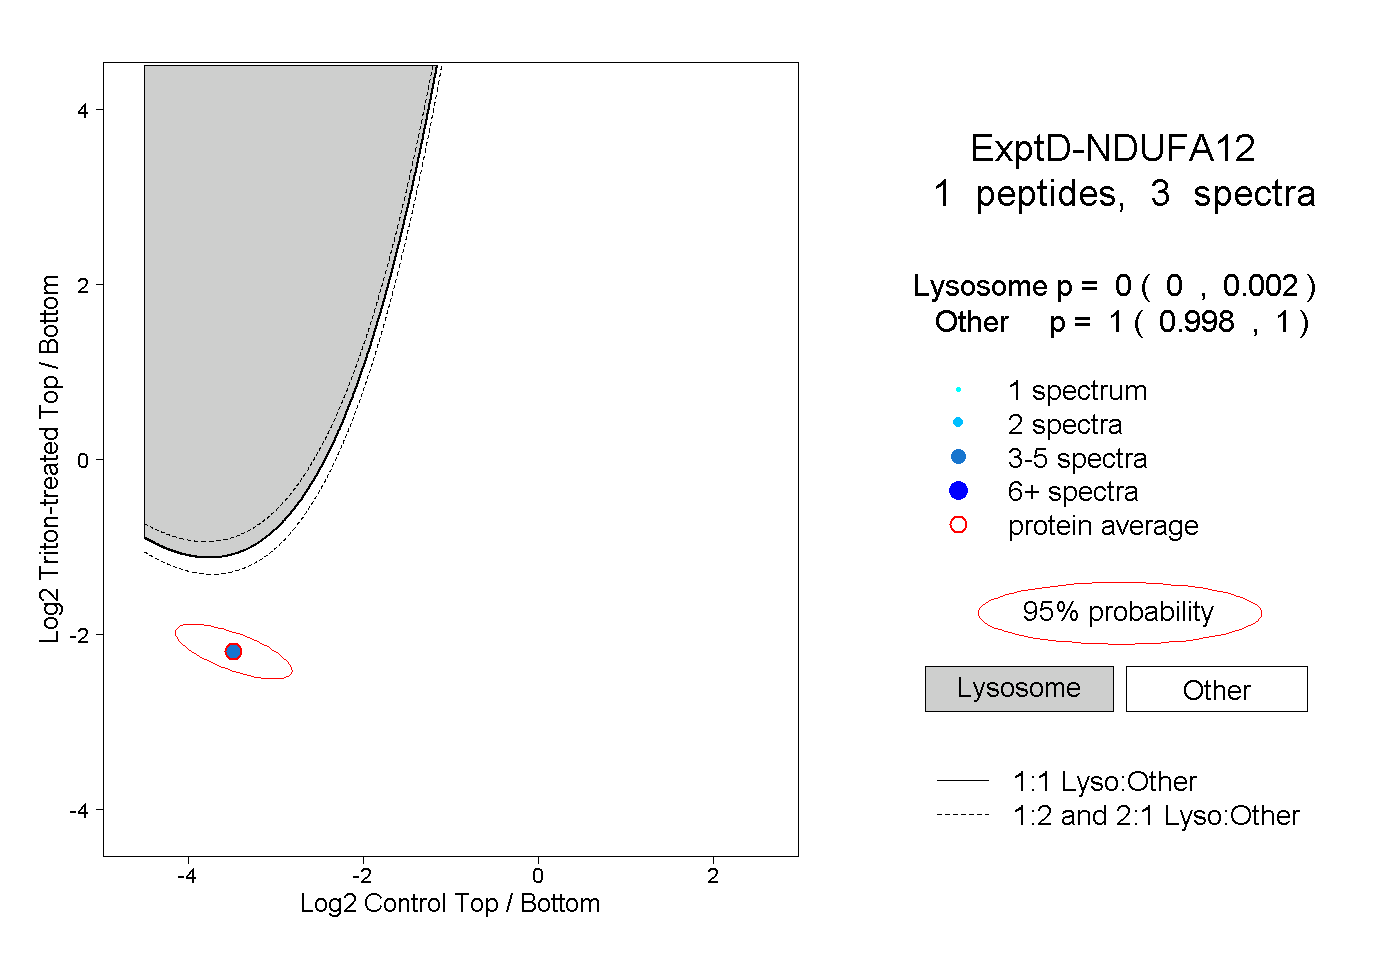
0.000 | 0.002
0.998 | 1.000