 6
6peptides
spectra
0.764 | 0.798
0.000 | 0.078
0.000 | 0.059
0.000 | 0.000
0.000 | 0.000
0.124 | 0.169
0.000 | 0.000
0.000 | 0.000
| Plot | Mito | Lyso | Perox | ER | Golgi | PM | Cytosol | Nucleus | |||||
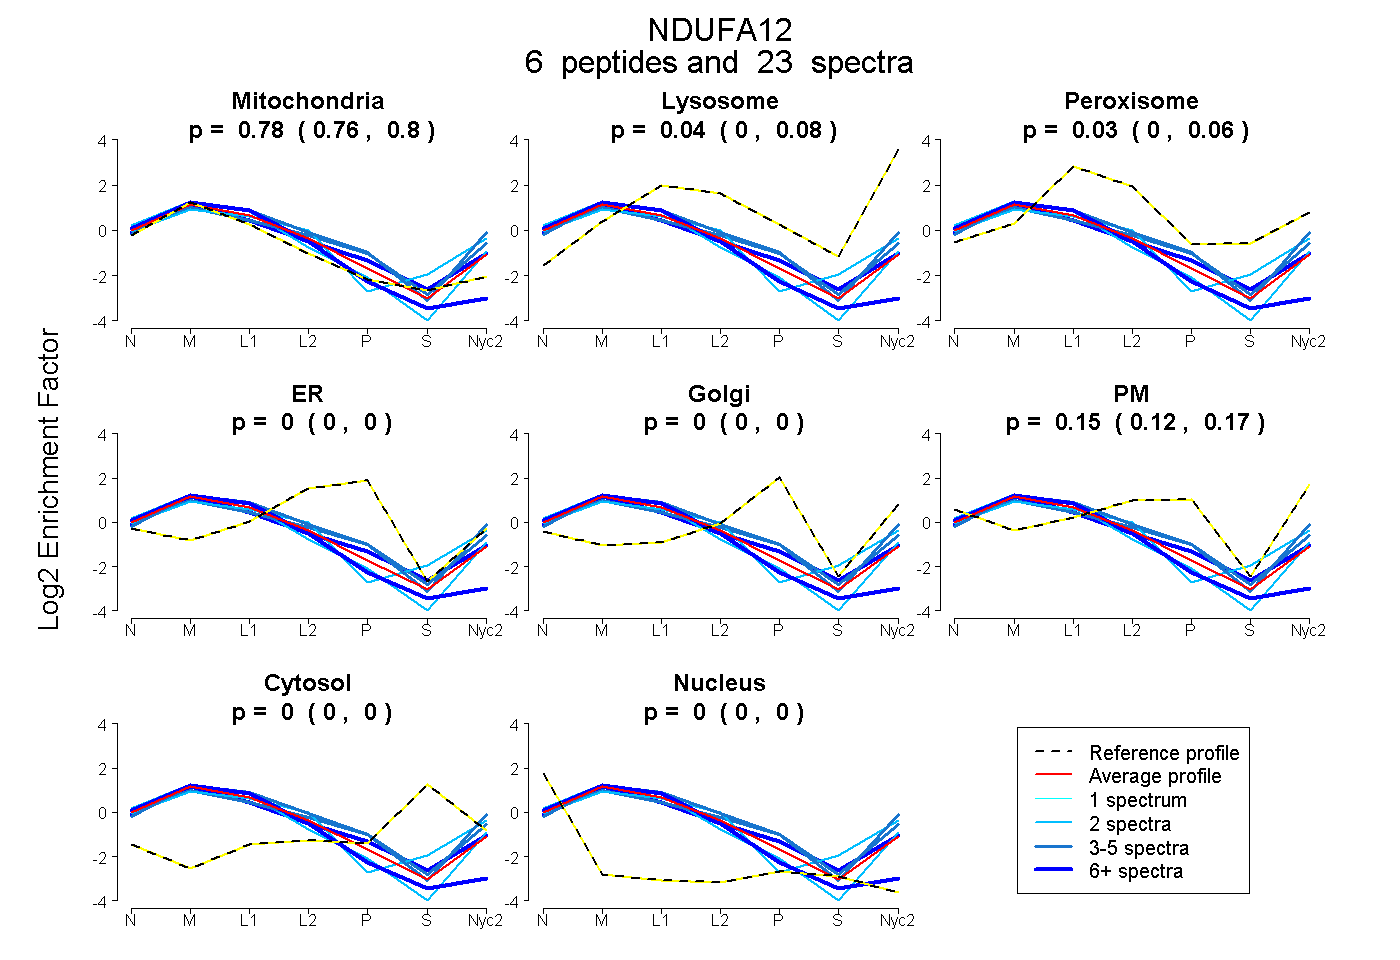
| Expt A |
6 peptides |
23 spectra |
|
0.784 0.764 | 0.798 |
0.041 0.000 | 0.078 |
0.027 0.000 | 0.059 |
0.000 0.000 | 0.000 |
0.000 0.000 | 0.000 |
0.148 0.124 | 0.169 |
0.000 0.000 | 0.000 |
0.000 0.000 | 0.000 |
| 3 spectra, GLQQVTGHGGLR | 0.643 | 0.042 | 0.000 | 0.000 | 0.000 | 0.315 | 0.000 | 0.000 | ||
| 2 spectra, FNVSATPEQYVPYSTTR | 0.842 | 0.000 | 0.000 | 0.000 | 0.000 | 0.158 | 0.000 | 0.000 | ||
| 3 spectra, NTFWDVDGSMVPPEWHR | 0.606 | 0.179 | 0.000 | 0.000 | 0.000 | 0.215 | 0.000 | 0.000 | ||
| 2 spectra, IQEWVPPSTPYK | 0.660 | 0.145 | 0.157 | 0.000 | 0.000 | 0.000 | 0.000 | 0.038 | ||
| 7 spectra, WLHCMTDDPPTTKPLTAR | 1.000 | 0.000 | 0.000 | 0.000 | 0.000 | 0.000 | 0.000 | 0.000 | ||
| 6 spectra, FIWTNHK | 0.756 | 0.055 | 0.000 | 0.000 | 0.000 | 0.189 | 0.000 | 0.000 |
| Plot | Mito | Lyso or Perox | ER | Golgi | PM | Cytosol | Nucleus | ||||||
| Expt B |
3 peptides |
6 spectra |
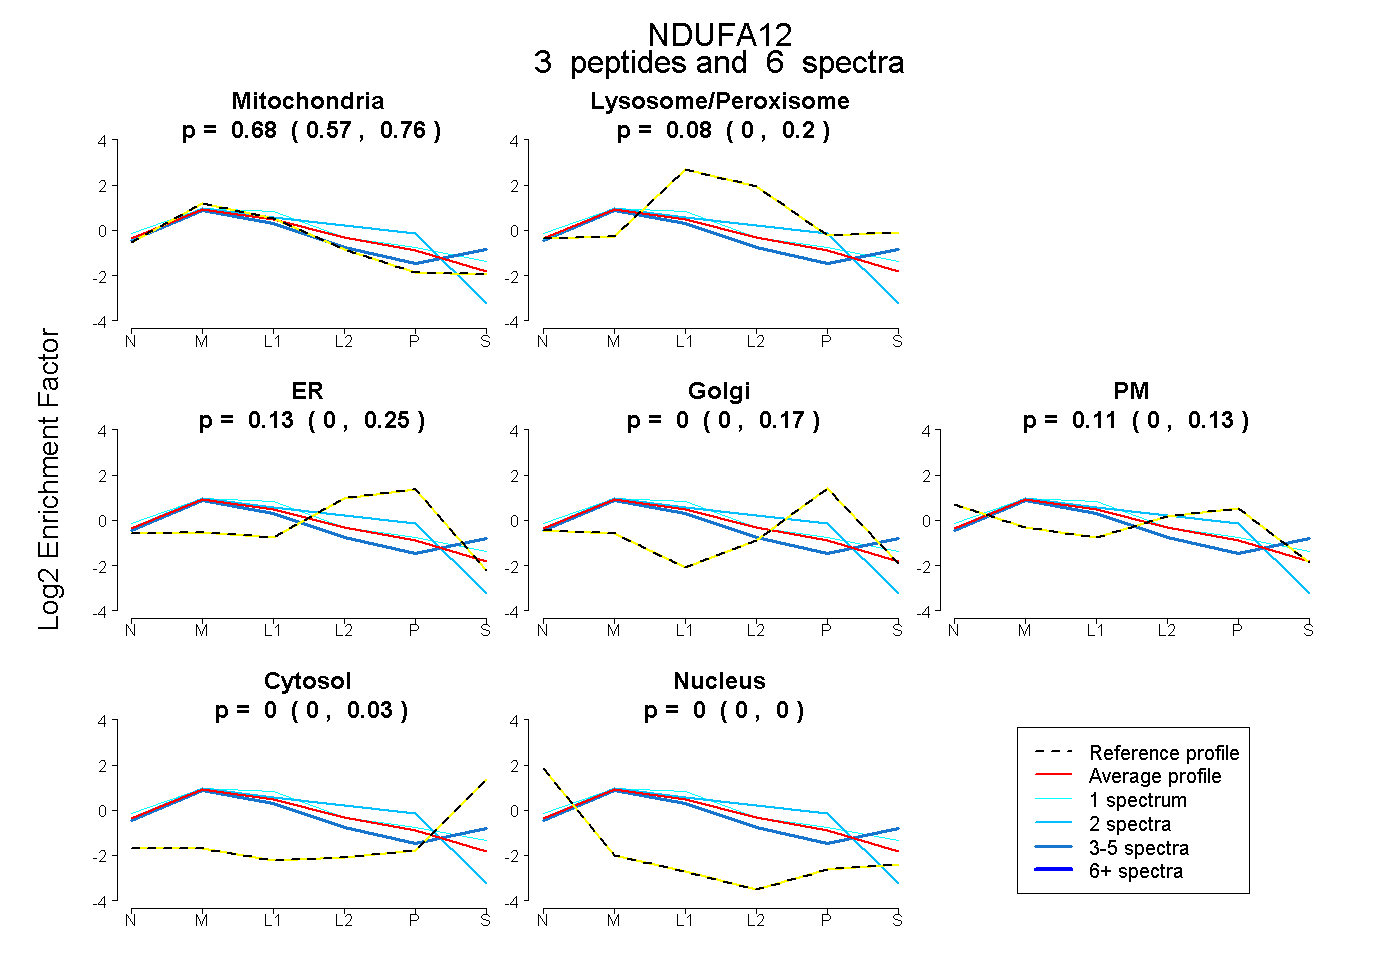 |
0.685 0.573 | 0.759 |
0.083 0.000 | 0.195 |
0.127 0.000 | 0.253 |
0.000 0.000 | 0.167 |
0.105 0.000 | 0.133 |
0.000 0.000 | 0.027 |
0.000 0.000 | 0.000 |
|||
| Plot | Lyso | Other | |||||||||||
| Expt C |
7 peptides |
56 spectra |
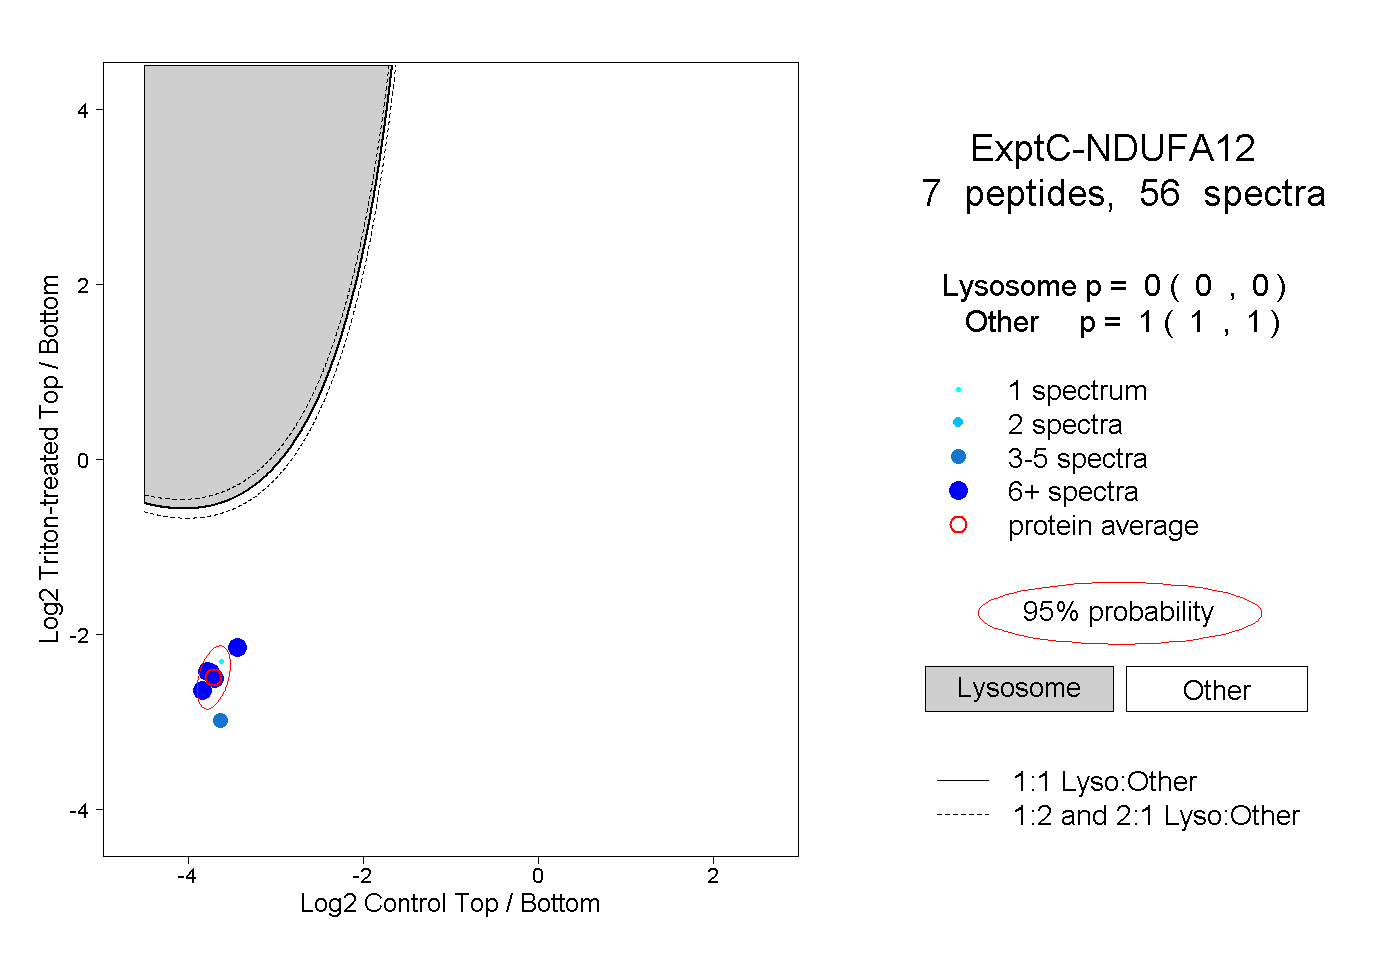 |
0.000 0.000 | 0.000 |
1.000 1.000 | 1.000 |
||||||||
| Plot | Lyso | Other | |||||||||||
| Expt D |
1 peptide |
3 spectra |
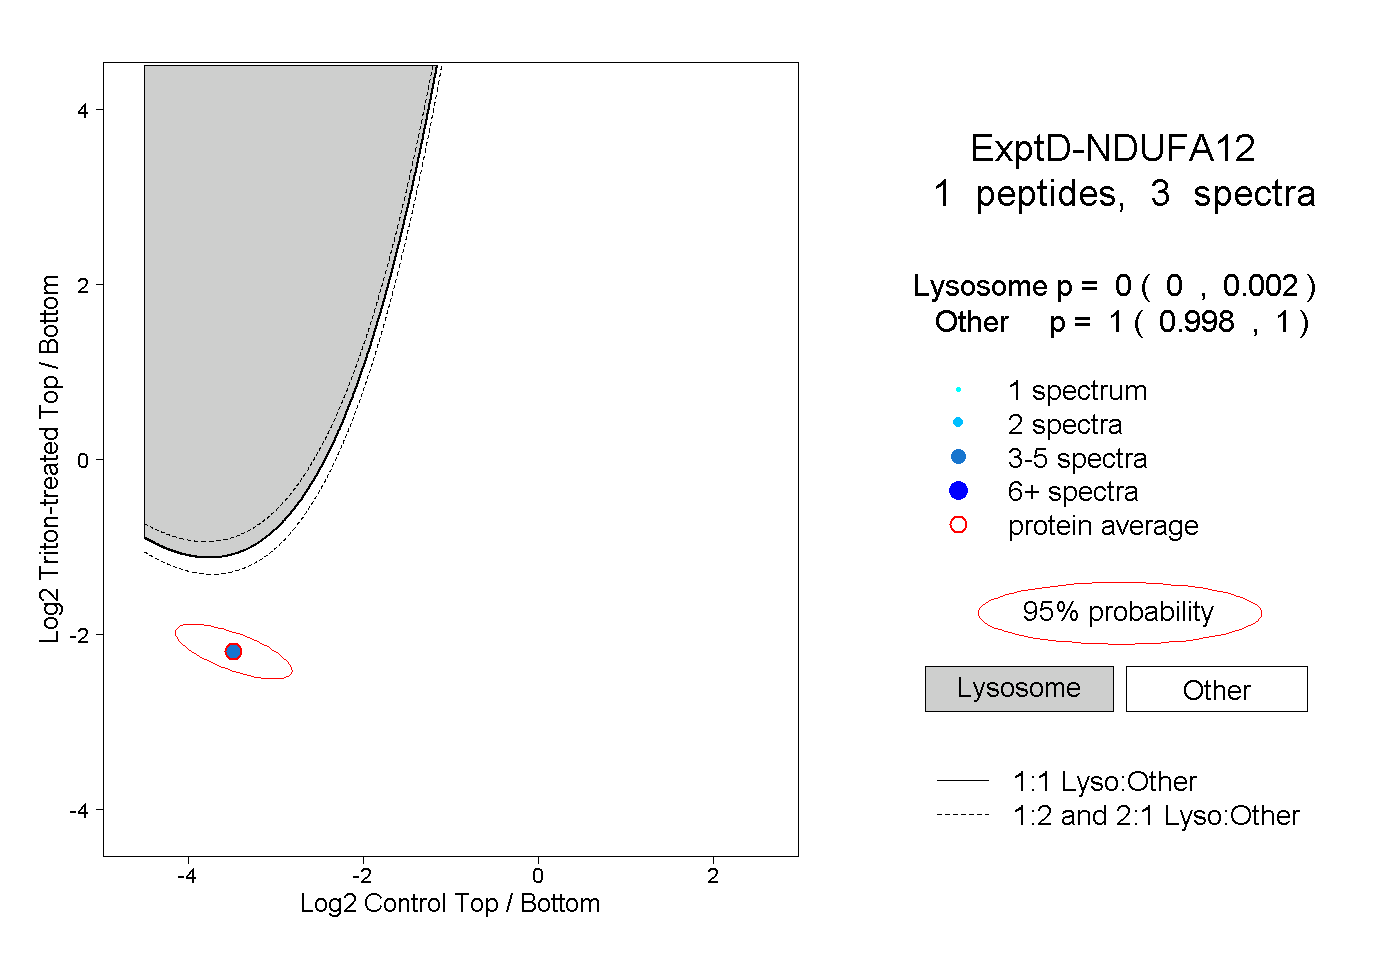 |
0.000 0.000 | 0.002 |
1.000 0.998 | 1.000 |