 11
11peptides
spectra
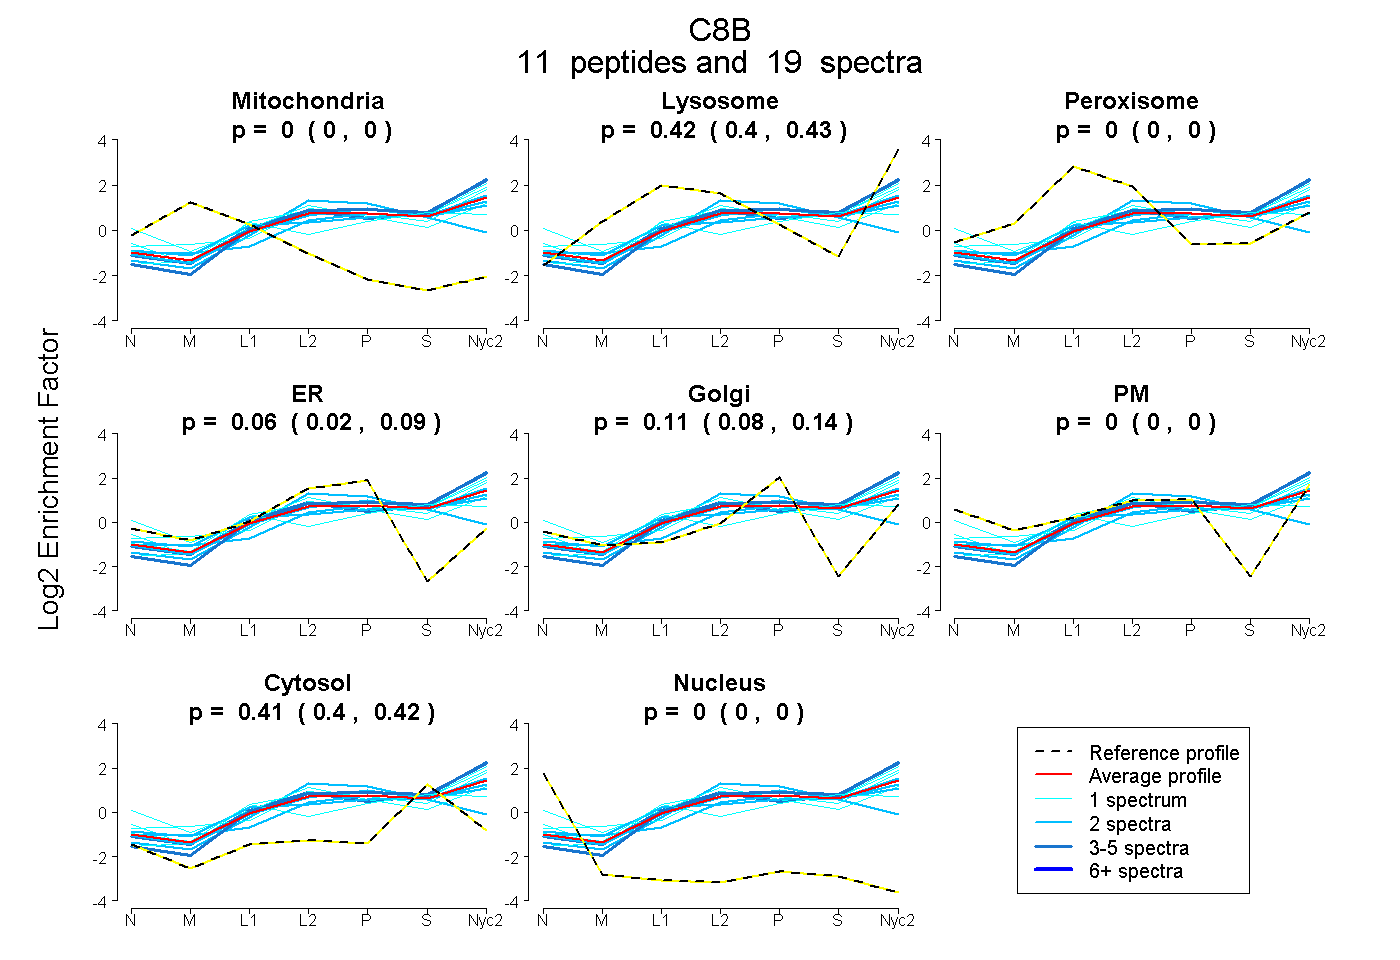
0.000 | 0.000
0.401 | 0.430
0.000 | 0.000
0.024 | 0.091
0.079 | 0.139
0.000 | 0.000
0.402 | 0.419
0.000 | 0.000
2peptides
spectra
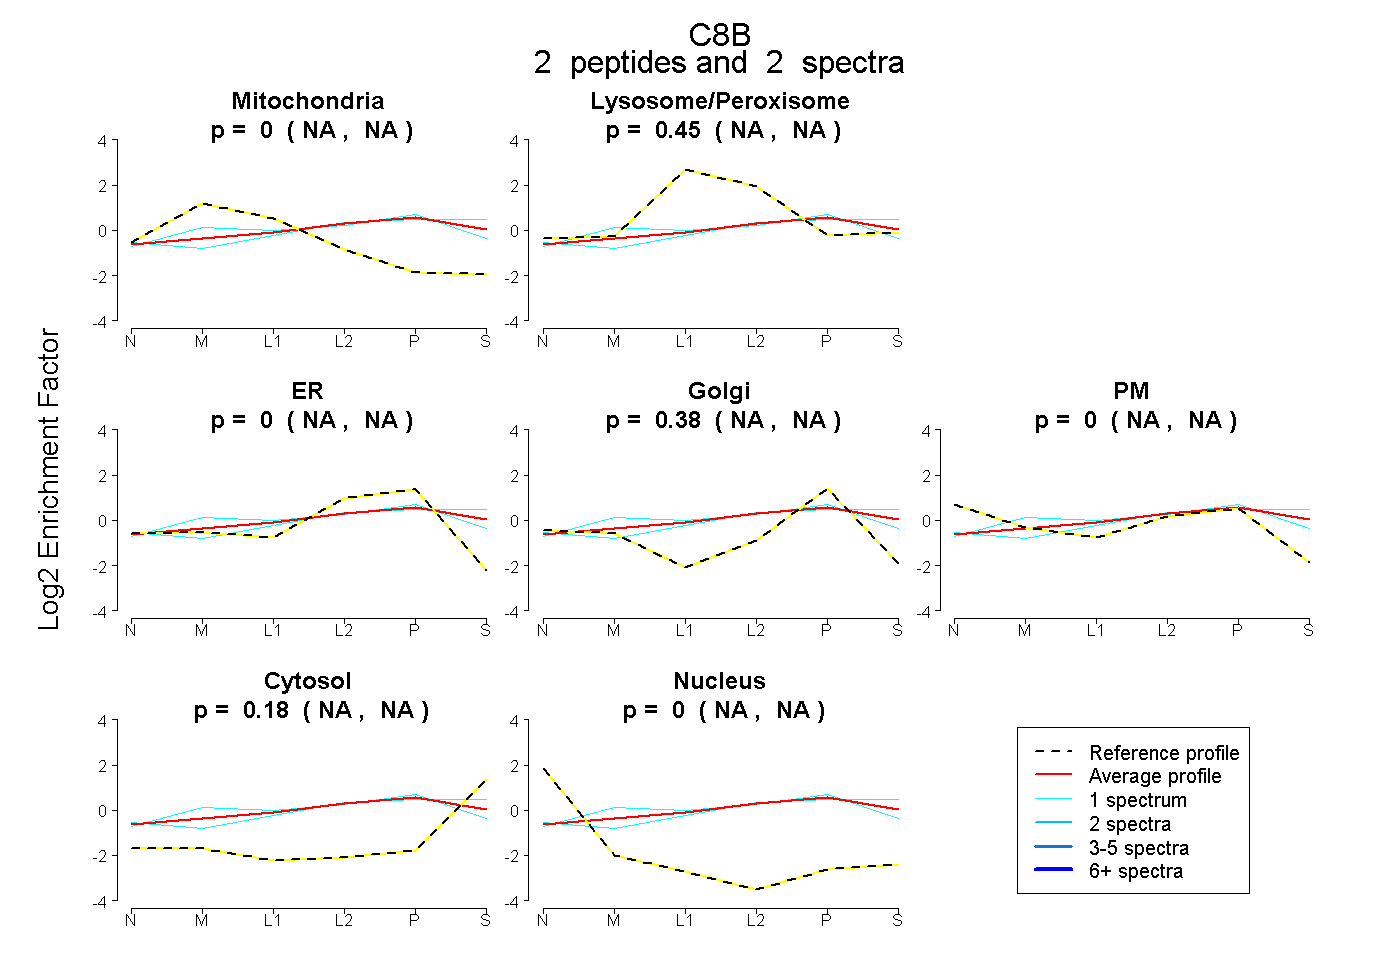
NA | NA
NA | NA
NA | NA
NA | NA
NA | NA
NA | NA
NA | NA
12peptides
spectra
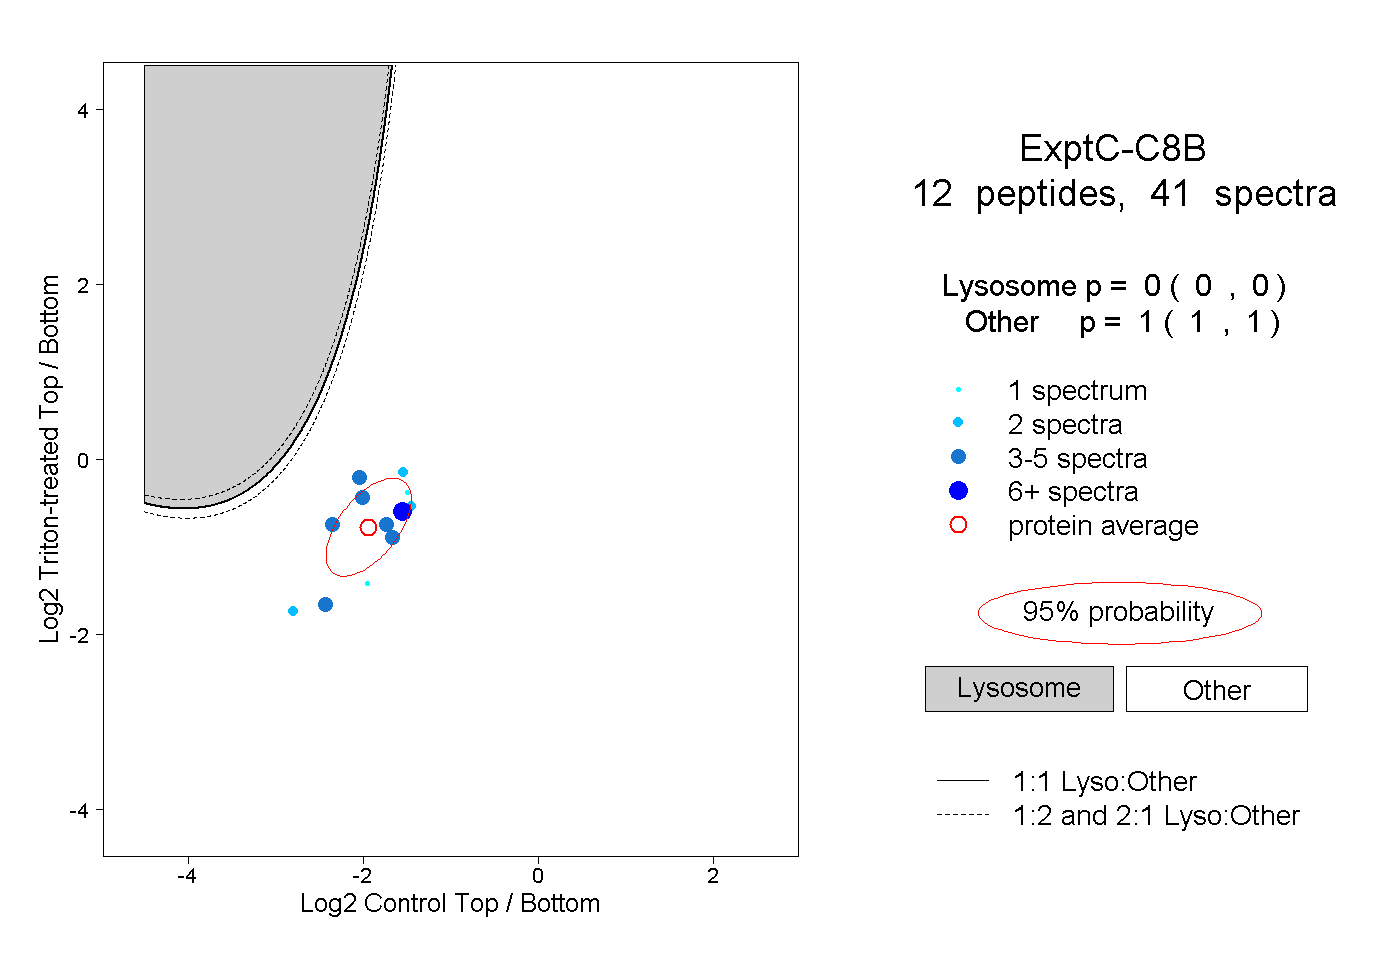
0.000 | 0.000
1.000 | 1.000
2peptides
spectra
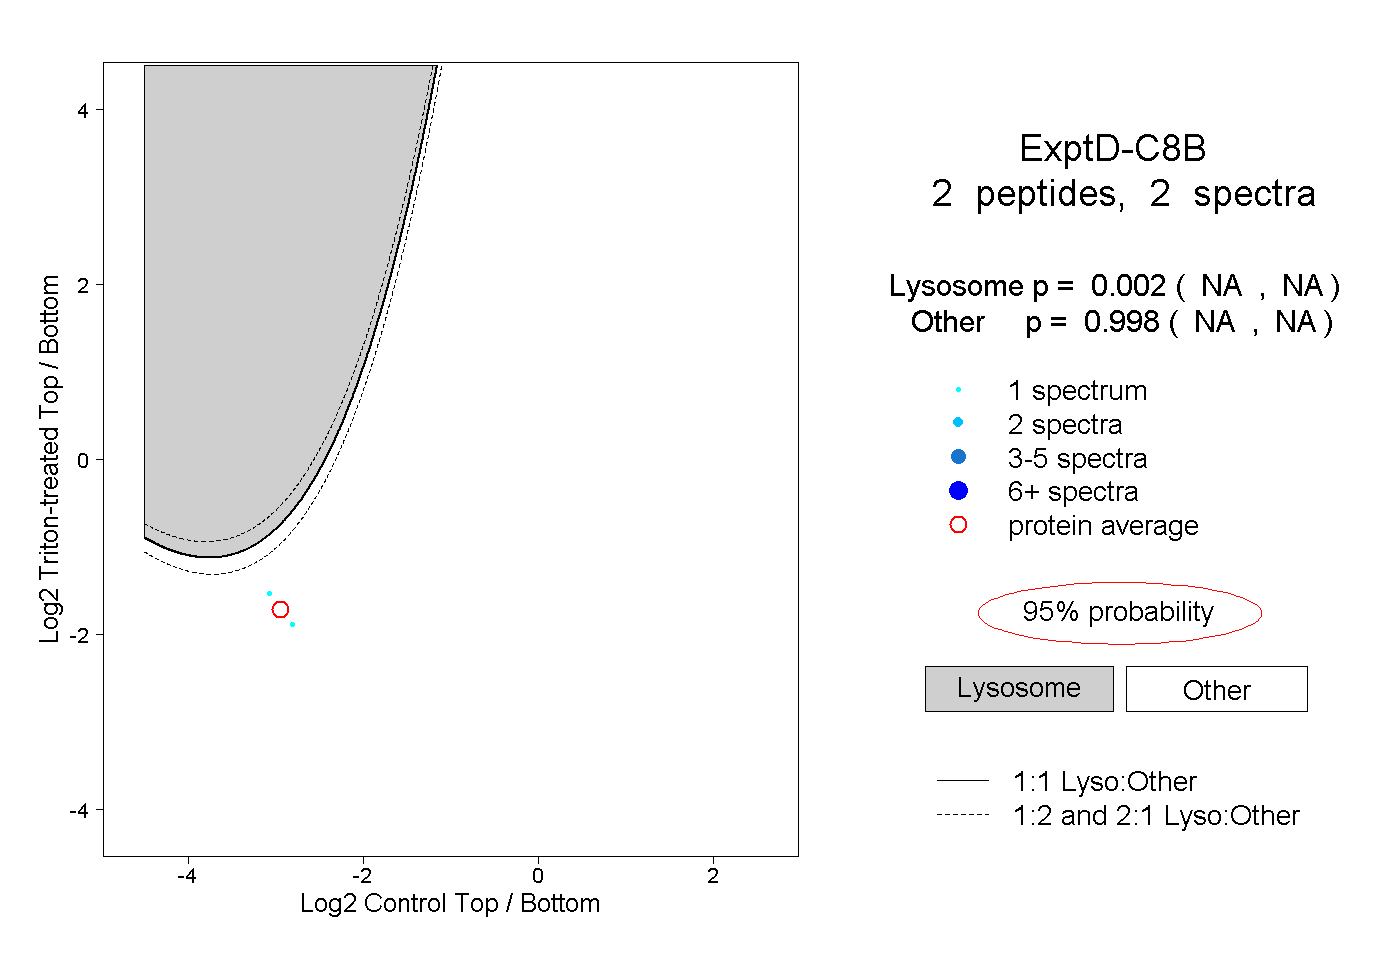
NA | NA
NA | NA