 11
11peptides
spectra
0.000 | 0.000
0.401 | 0.430
0.000 | 0.000
0.024 | 0.091
0.079 | 0.139
0.000 | 0.000
0.402 | 0.419
0.000 | 0.000
| Plot | Mito | Lyso | Perox | ER | Golgi | PM | Cytosol | Nucleus | |||||
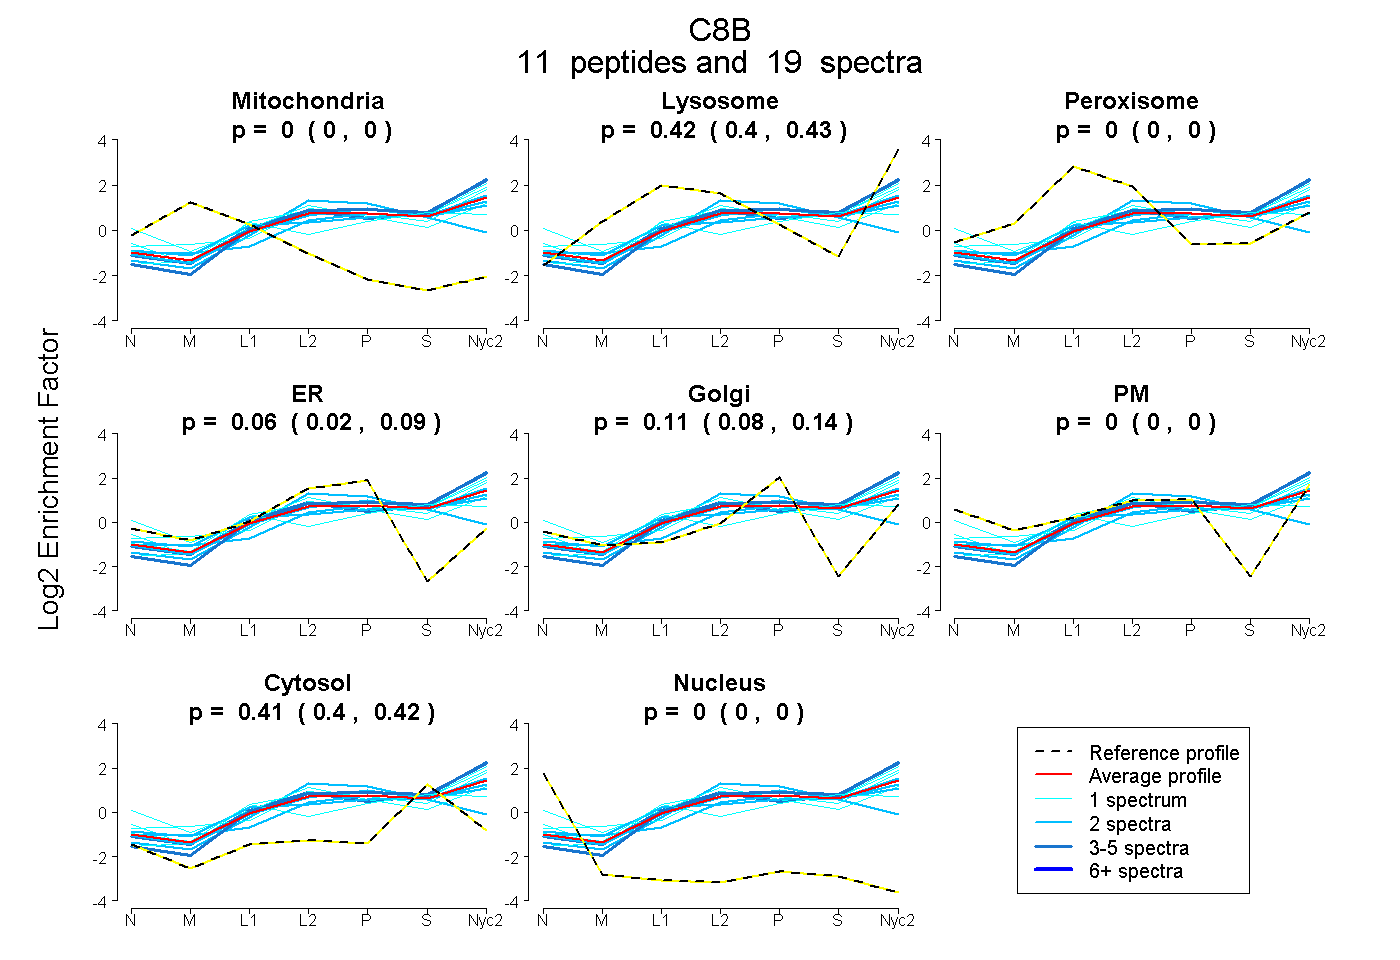
| Expt A |
11 peptides |
19 spectra |
|
0.000 0.000 | 0.000 |
0.416 0.401 | 0.430 |
0.000 0.000 | 0.000 |
0.061 0.024 | 0.091 |
0.112 0.079 | 0.139 |
0.000 0.000 | 0.000 |
0.411 0.402 | 0.419 |
0.000 0.000 | 0.000 |
| 3 spectra, TMVEDLVVLVR | 0.000 | 0.504 | 0.000 | 0.000 | 0.086 | 0.000 | 0.410 | 0.000 | ||
| 1 spectrum, DLPTAELMK | 0.000 | 0.484 | 0.000 | 0.000 | 0.132 | 0.000 | 0.384 | 0.000 | ||
| 2 spectra, SVLEVAHYK | 0.000 | 0.369 | 0.000 | 0.076 | 0.148 | 0.000 | 0.408 | 0.000 | ||
| 1 spectrum, GGTSEYITSLAYK | 0.000 | 0.473 | 0.000 | 0.000 | 0.000 | 0.140 | 0.387 | 0.000 | ||
| 2 spectra, SLPLEYSYGEYR | 0.000 | 0.454 | 0.000 | 0.000 | 0.126 | 0.000 | 0.420 | 0.000 | ||
| 3 spectra, LDGLVEFGVR | 0.000 | 0.551 | 0.000 | 0.000 | 0.045 | 0.000 | 0.404 | 0.000 | ||
| 1 spectrum, NNGVPILK | 0.000 | 0.419 | 0.000 | 0.000 | 0.129 | 0.120 | 0.333 | 0.000 | ||
| 2 spectra, CEGFVCAQTGR | 0.000 | 0.121 | 0.051 | 0.396 | 0.000 | 0.000 | 0.432 | 0.000 | ||
| 1 spectrum, YYAGACSPHYILNTNFR | 0.000 | 0.233 | 0.144 | 0.000 | 0.131 | 0.000 | 0.492 | 0.000 | ||
| 2 spectra, QLMLHYEFLQR | 0.000 | 0.311 | 0.000 | 0.000 | 0.252 | 0.000 | 0.437 | 0.000 | ||
| 1 spectrum, QCNNPAPQR | 0.000 | 0.106 | 0.161 | 0.000 | 0.000 | 0.432 | 0.301 | 0.000 |
| Plot | Mito | Lyso or Perox | ER | Golgi | PM | Cytosol | Nucleus | ||||||
| Expt B |
2 peptides |
2 spectra |
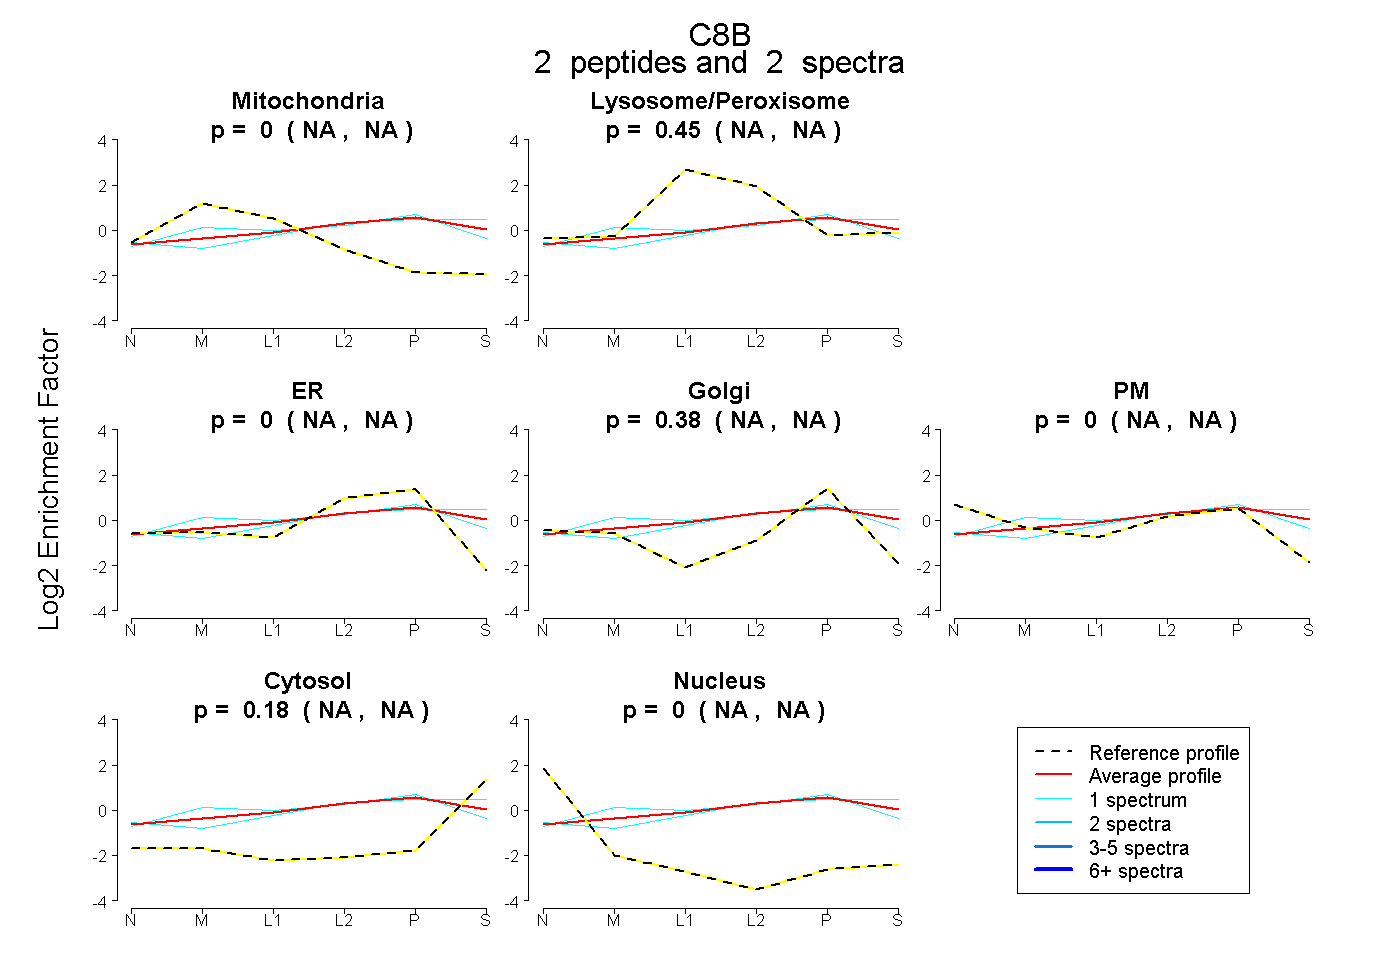 |
0.000 NA | NA |
0.449 NA | NA |
0.000 NA | NA |
0.376 NA | NA |
0.000 NA | NA |
0.175 NA | NA |
0.000 NA | NA |
|||
| Plot | Lyso | Other | |||||||||||
| Expt C |
12 peptides |
41 spectra |
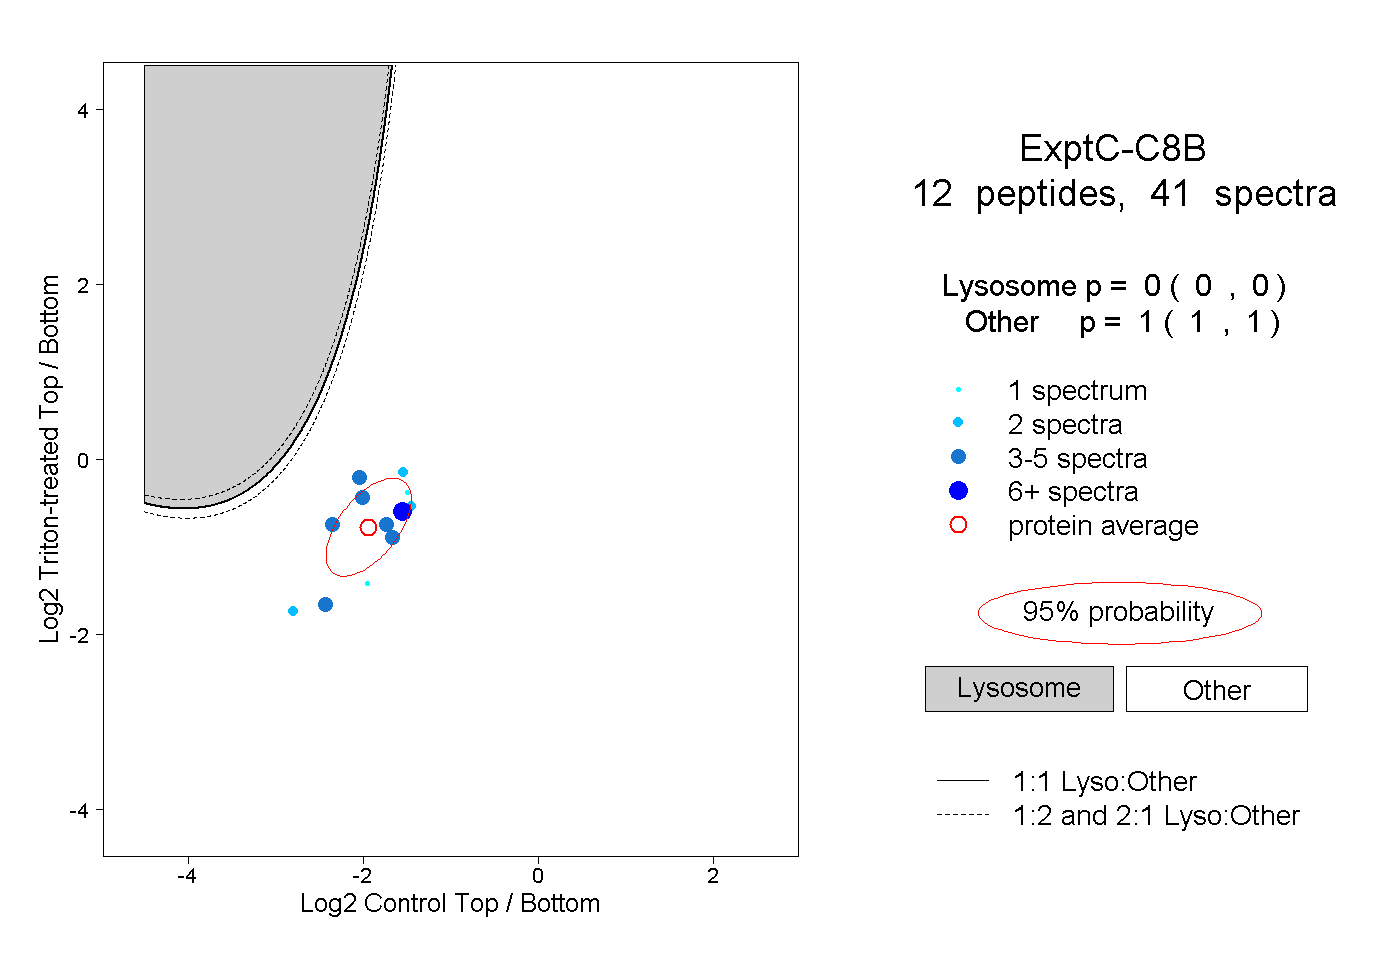 |
0.000 0.000 | 0.000 |
1.000 1.000 | 1.000 |
||||||||
| Plot | Lyso | Other | |||||||||||
| Expt D |
2 peptides |
2 spectra |
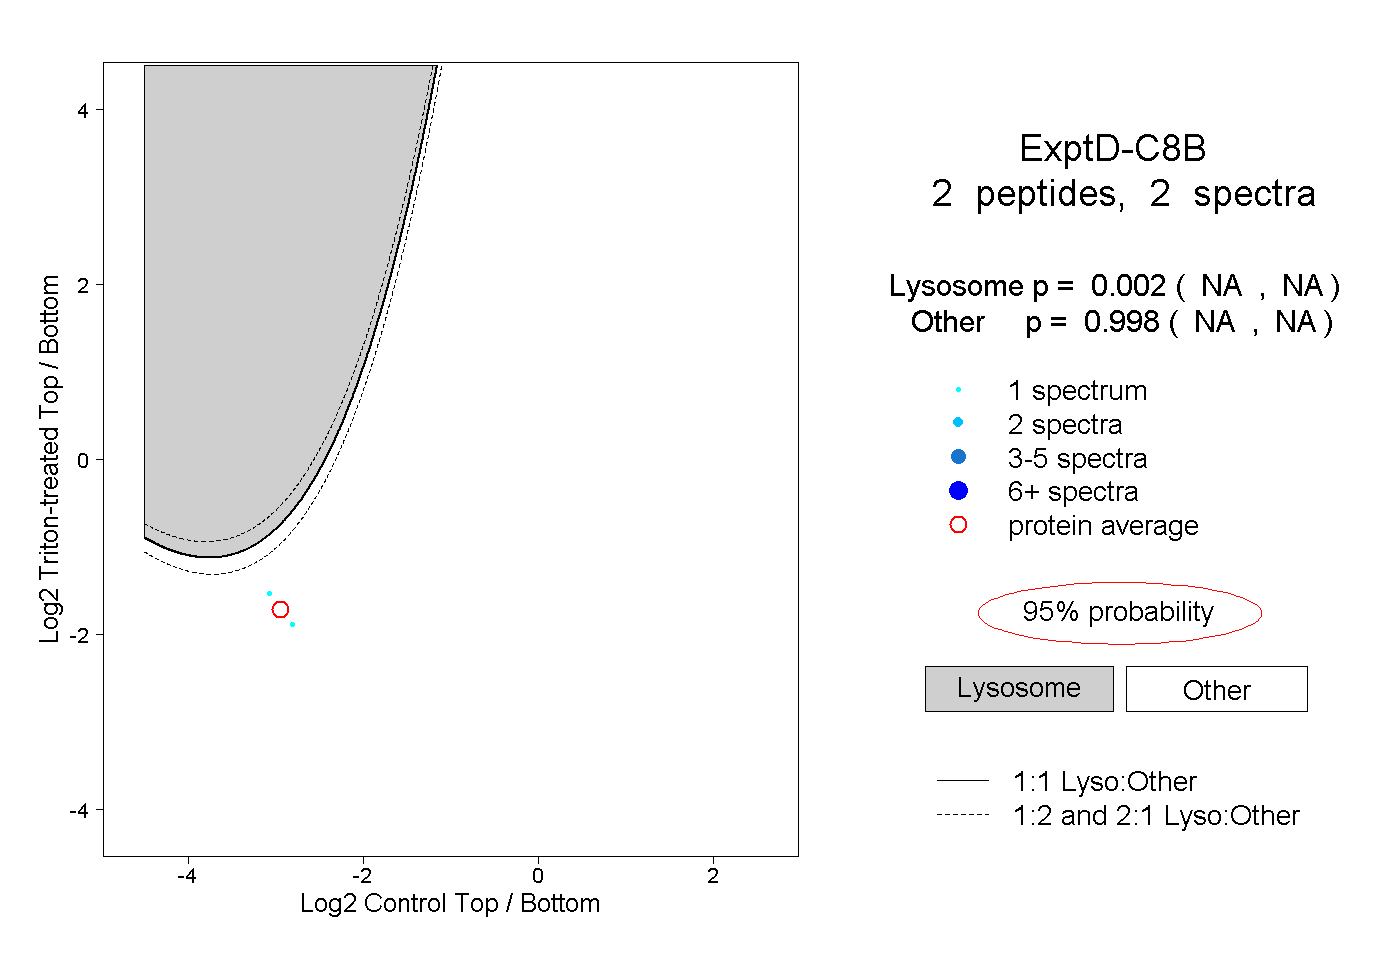 |
0.002 NA | NA |
0.998 NA | NA |