 40
40peptides
spectra
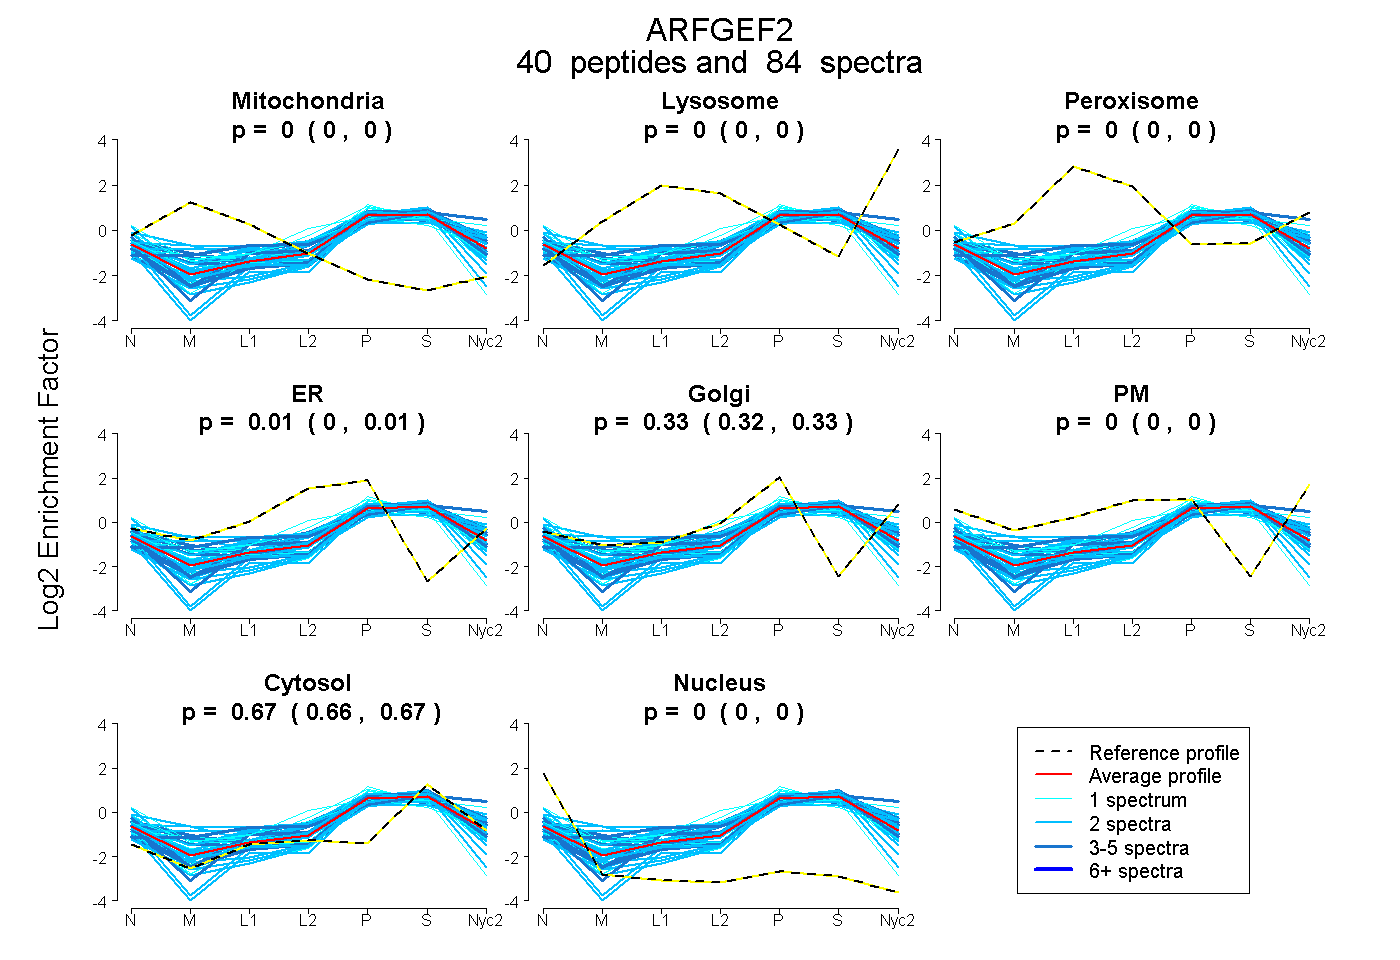
0.000 | 0.000
0.000 | 0.000
0.000 | 0.000
0.000 | 0.014
0.319 | 0.334
0.000 | 0.000
0.664 | 0.668
0.000 | 0.000
4peptides
spectra
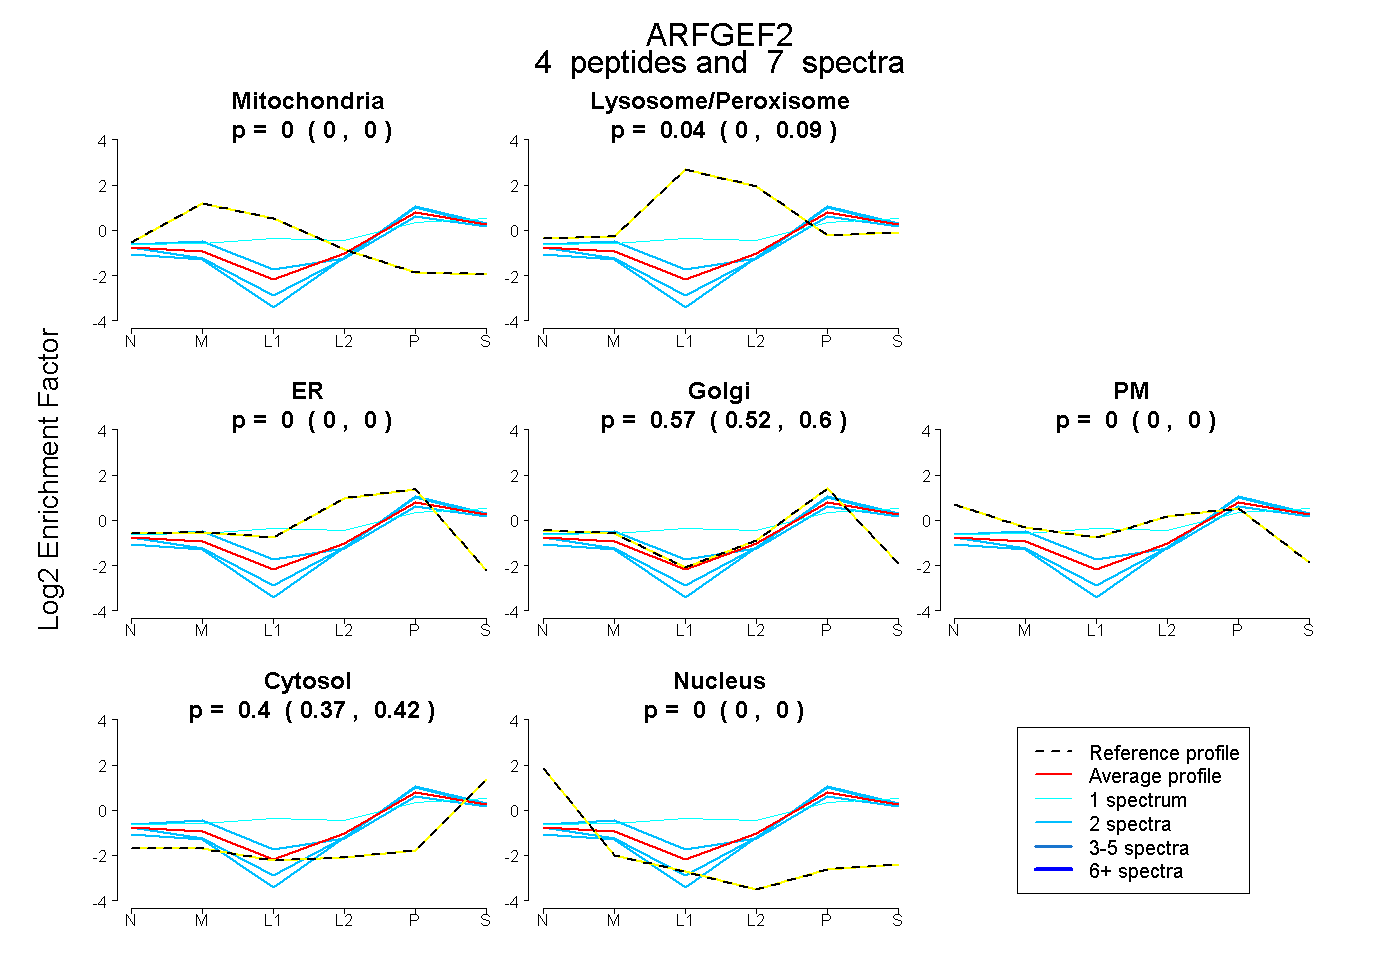
0.000 | 0.000
0.000 | 0.092
0.000 | 0.000
0.519 | 0.600
0.000 | 0.000
0.368 | 0.417
0.000 | 0.000
27peptides
spectra
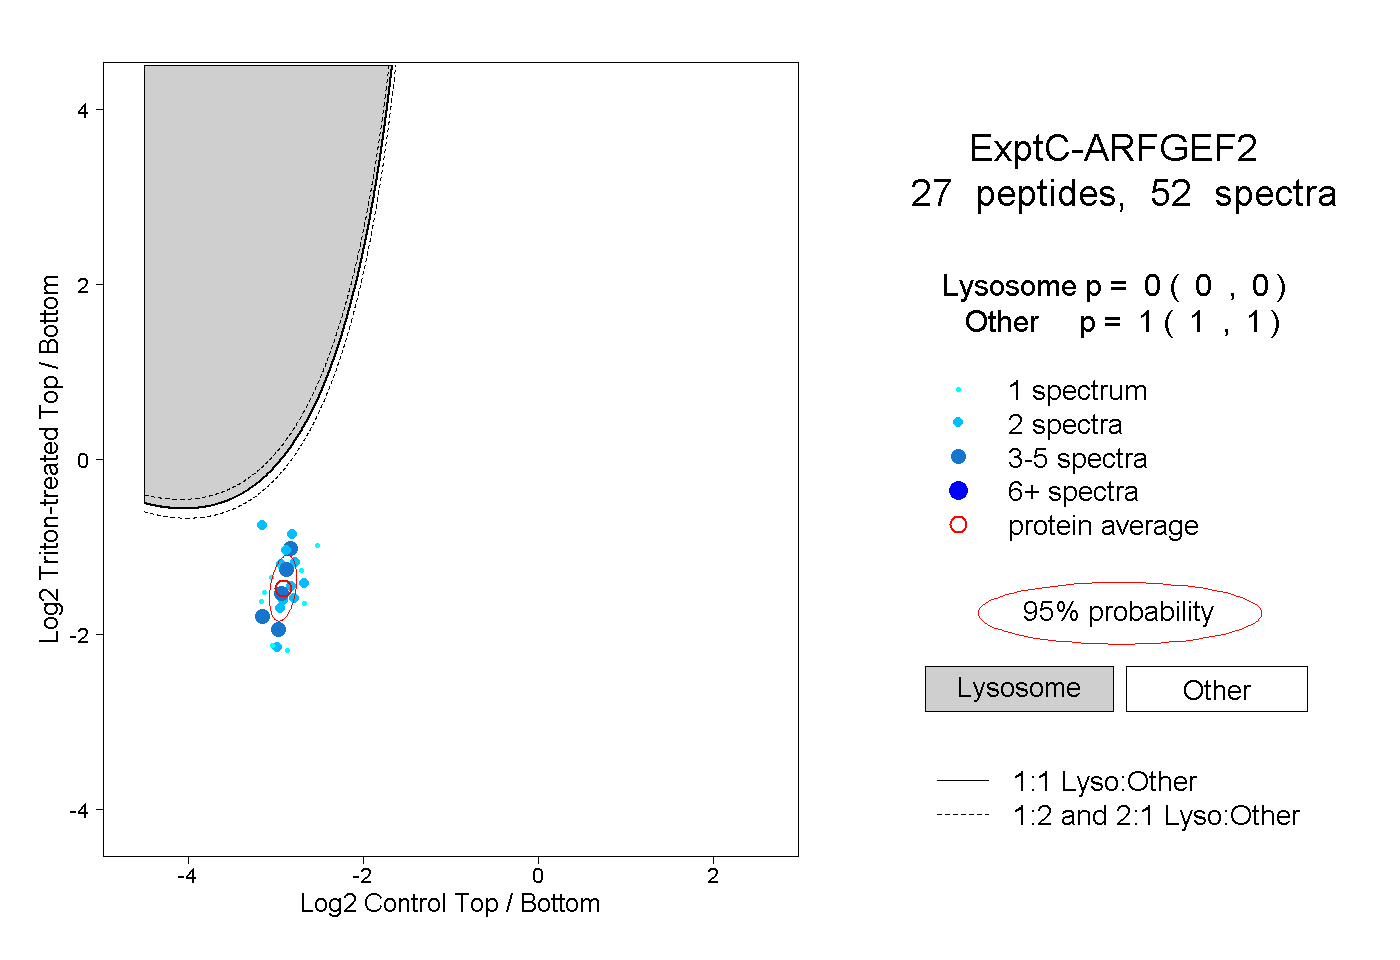
0.000 | 0.000
1.000 | 1.000
4peptides
spectra
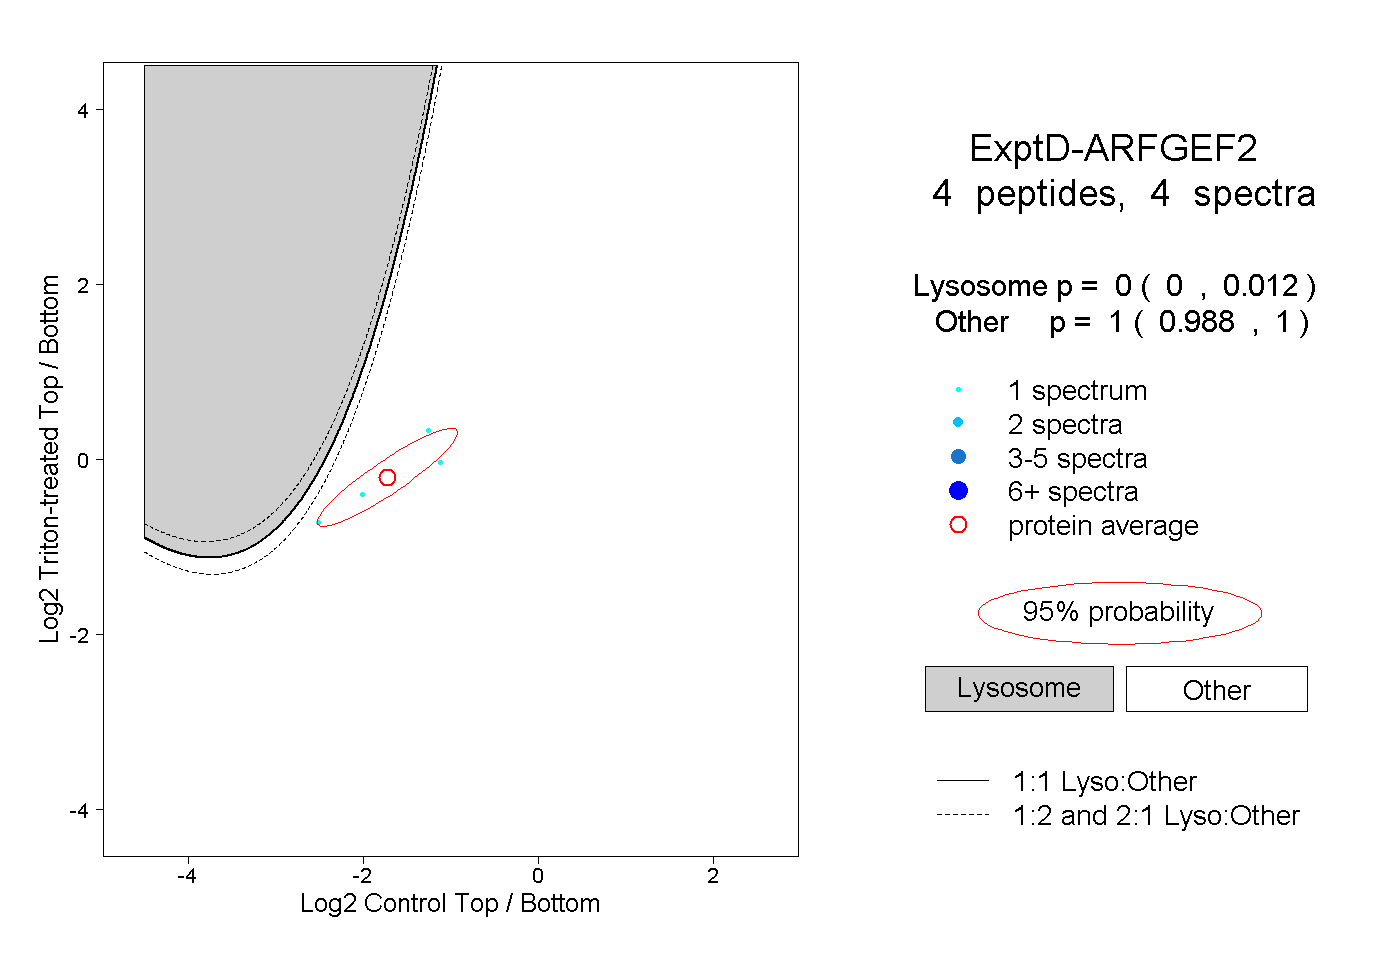
0.000 | 0.012
0.988 | 1.000