ARFGEF2
[ENSRNOP00000010054]
Main page
| | | Plot |
Mito |
Lyso |
|
Perox |
ER |
Golgi |
PM |
Cytosol |
Nucleus |
|
| Expt A |
 40
40
peptides |
84
spectra |
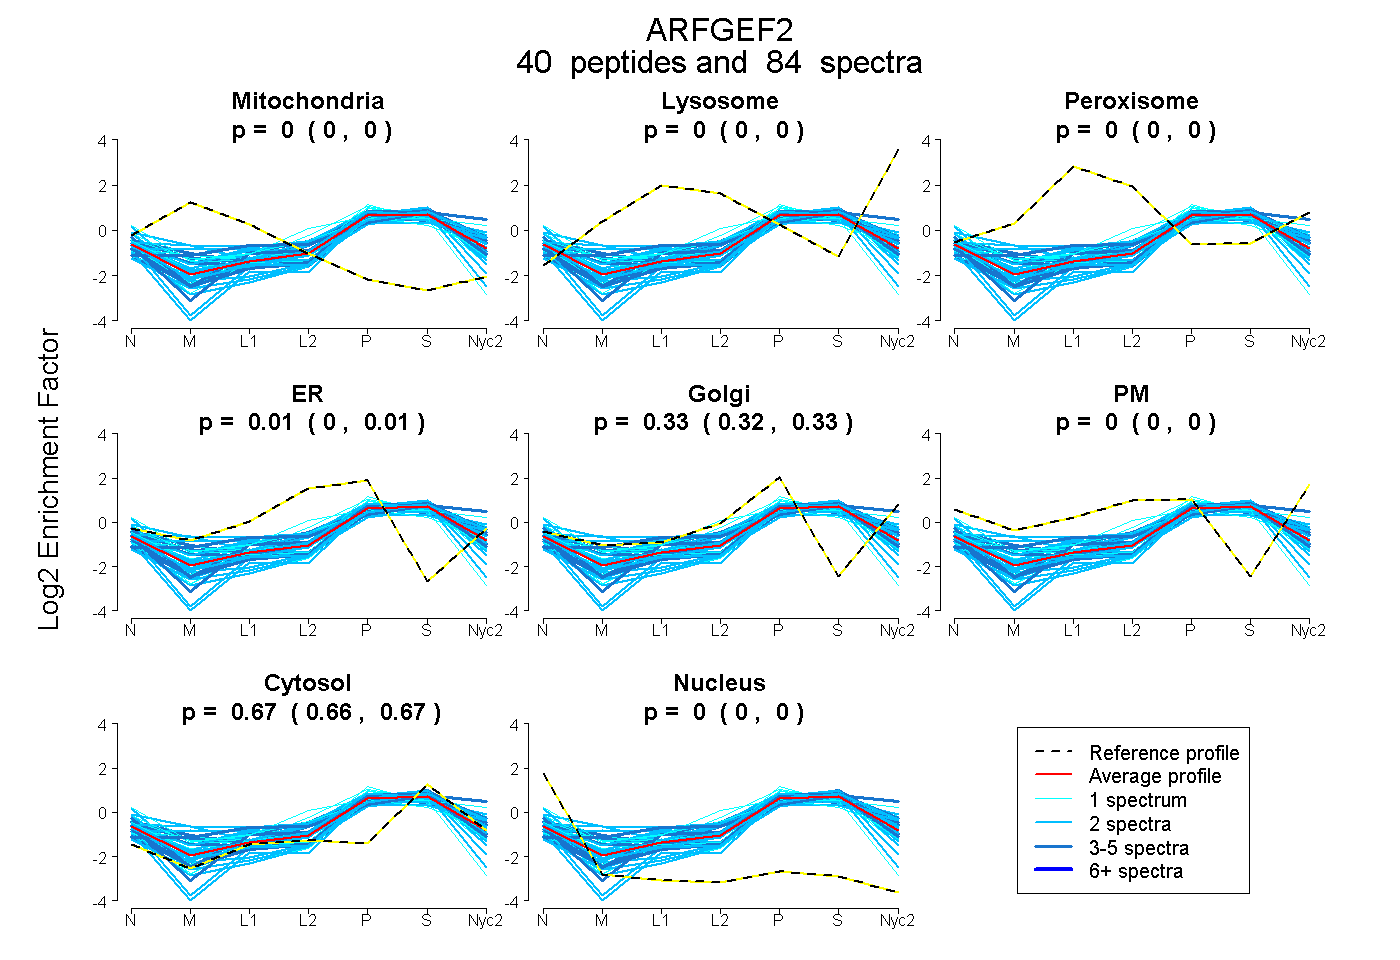 |
0.000
0.000 | 0.000 |
0.000
0.000 | 0.000 |
|
0.000
0.000 | 0.000 |
0.007
0.000 | 0.014 |
0.328
0.319 | 0.334 |
0.000
0.000 | 0.000 |
0.666
0.664 | 0.668 |
0.000
0.000 | 0.000 |
|
| | | Plot |
Mito |
|
Lyso or Perox |
|
ER |
Golgi |
PM |
Cytosol |
Nucleus |
|
| Expt B |
4
peptides |
7
spectra |
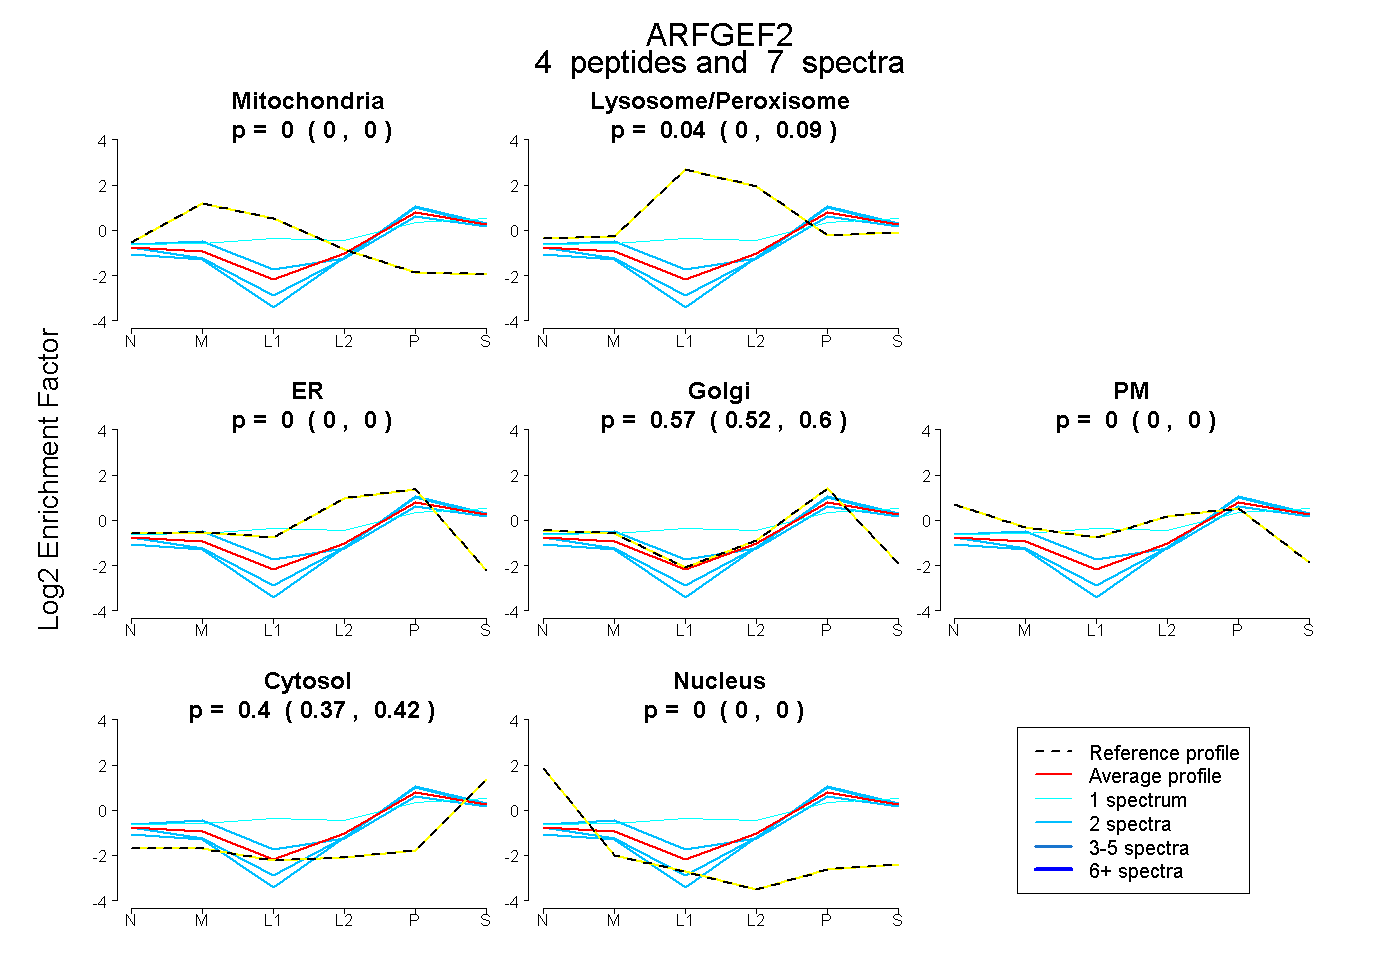 |
0.000
0.000 | 0.000 |
|
0.039
0.000 | 0.092 |
|
0.000
0.000 | 0.000 |
0.566
0.519 | 0.600 |
0.000
0.000 | 0.000 |
0.396
0.368 | 0.417 |
0.000
0.000 | 0.000 |
|
| | | Plot |
|
Lyso |
|
|
|
|
|
|
|
Other |
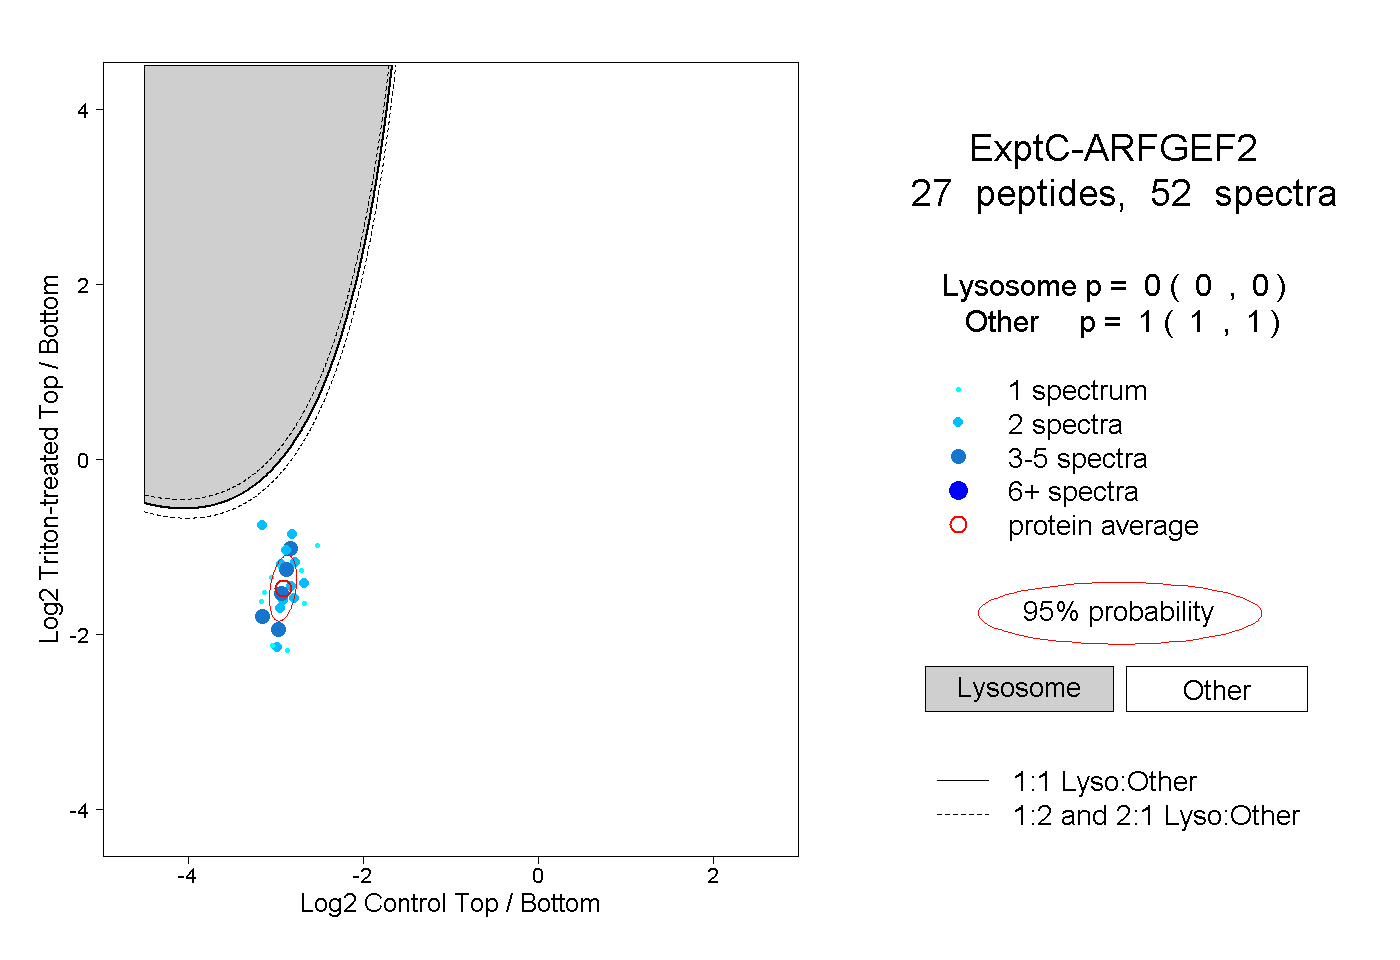
| Expt C |
27
peptides |
52
spectra |
 |
|
0.000
0.000 | 0.000 |
|
|
|
|
|
|
|
1.000
1.000 | 1.000 |
| 3 spectra, DFLRPFEHIMK |
|
0.000 |
|
|
|
|
|
|
|
1.000 |
| 2 spectra, AFNSNYEQR |
|
0.000 |
|
|
|
|
|
|
|
1.000 |
| 2 spectra, GINDSK |
|
0.000 |
|
|
|
|
|
|
|
1.000 |
| 1 spectrum, NLDTIK |
|
0.000 |
|
|
|
|
|
|
|
1.000 |
| 2 spectra, NLINQTTAK |
|
0.000 |
|
|
|
|
|
|
|
1.000 |
| 2 spectra, TFLEGFR |
|
0.000 |
|
|
|
|
|
|
|
1.000 |
| 1 spectrum, LPGEAQK |
|
0.000 |
|
|
|
|
|
|
|
1.000 |
| 2 spectra, MENQVLQEAR |
|
0.000 |
|
|
|
|
|
|
|
1.000 |
| 1 spectrum, GLECLVSILK |
|
0.000 |
|
|
|
|
|
|
|
1.000 |
| 1 spectrum, EHTMATK |
|
0.000 |
|
|
|
|
|
|
|
1.000 |
| 2 spectra, IFTGSTR |
|
0.005 |
|
|
|
|
|
|
|
0.995 |
| 1 spectrum, DAYVQALAR |
|
0.000 |
|
|
|
|
|
|
|
1.000 |
| 1 spectrum, DSWGEIQQR |
|
0.000 |
|
|
|
|
|
|
|
1.000 |
| 1 spectrum, HLDVDLDR |
|
0.000 |
|
|
|
|
|
|
|
1.000 |
| 4 spectra, SKPNLLK |
|
0.000 |
|
|
|
|
|
|
|
1.000 |
| 2 spectra, IGLVYK |
|
0.000 |
|
|
|
|
|
|
|
1.000 |
| 1 spectrum, MFSLQK |
|
0.000 |
|
|
|
|
|
|
|
1.000 |
| 2 spectra, DAFLVFR |
|
0.000 |
|
|
|
|
|
|
|
1.000 |
| 2 spectra, GAPYANQK |
|
0.000 |
|
|
|
|
|
|
|
1.000 |
| 1 spectrum, IACIFGMQLER |
|
0.000 |
|
|
|
|
|
|
|
1.000 |
| 4 spectra, YVSERPR |
|
0.000 |
|
|
|
|
|
|
|
1.000 |
| 4 spectra, QNVASEK |
|
0.000 |
|
|
|
|
|
|
|
1.000 |
| 2 spectra, EIIEHGIELFNK |
|
0.000 |
|
|
|
|
|
|
|
1.000 |
| 2 spectra, ALMEAVSHAK |
|
0.000 |
|
|
|
|
|
|
|
1.000 |
| 2 spectra, LPEQQSEK |
|
0.000 |
|
|
|
|
|
|
|
1.000 |
| 3 spectra, LDGNAIVDFVR |
|
0.000 |
|
|
|
|
|
|
|
1.000 |
| 1 spectrum, SMFVSR |
|
0.000 |
|
|
|
|
|
|
|
1.000 |
| | | Plot |
|
Lyso |
|
|
|
|
|
|
|
Other |
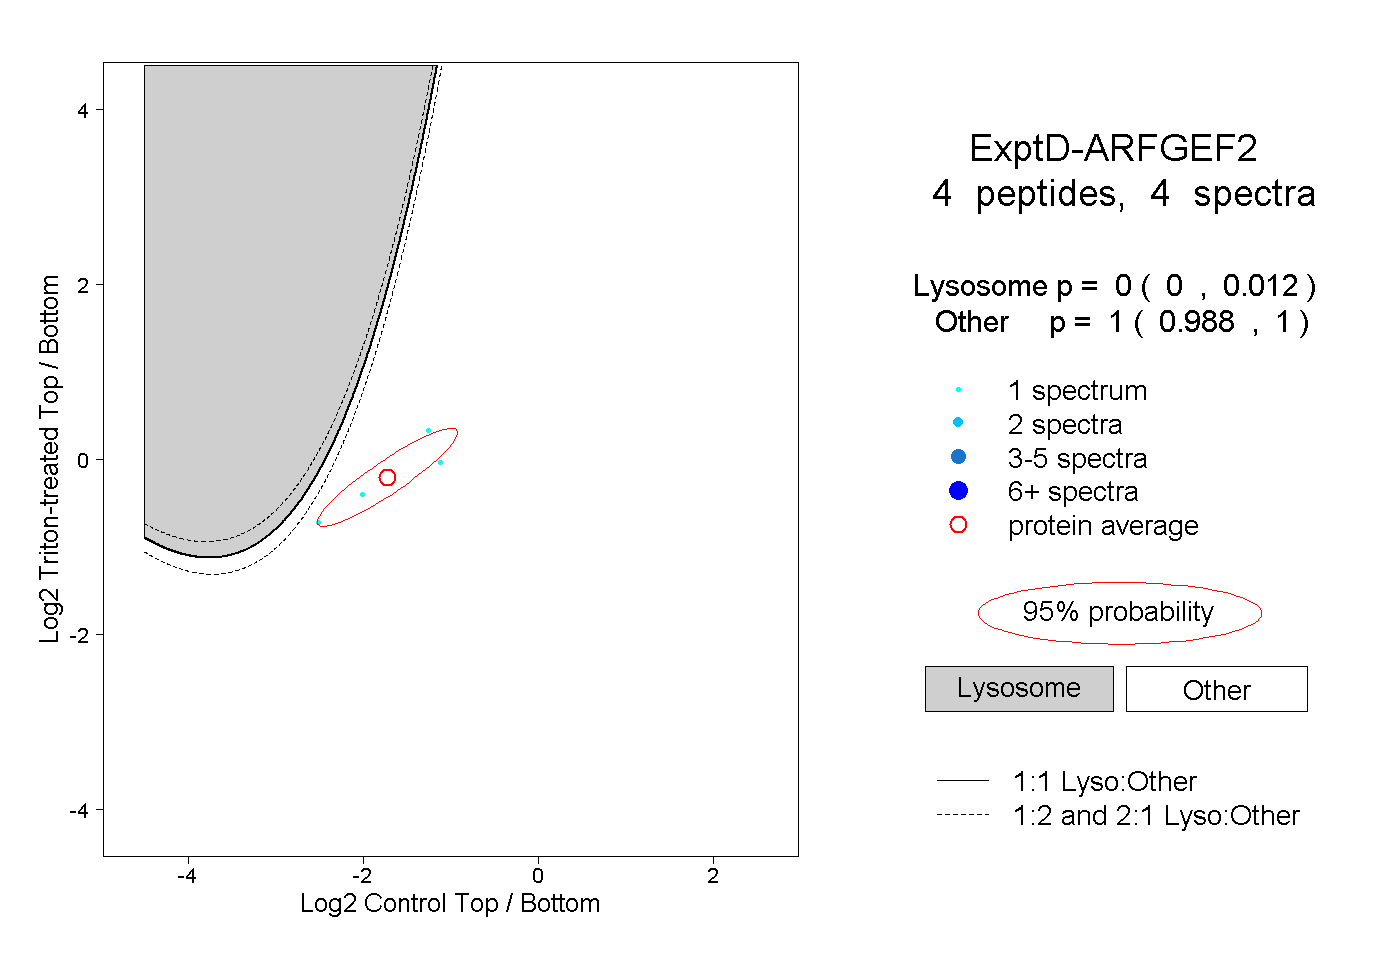
| Expt D |
4
peptides |
4
spectra |
 |
|
0.000
0.000 | 0.012 |
|
|
|
|
|
|
|
1.000
0.988 | 1.000 |