 2
2peptides
spectra
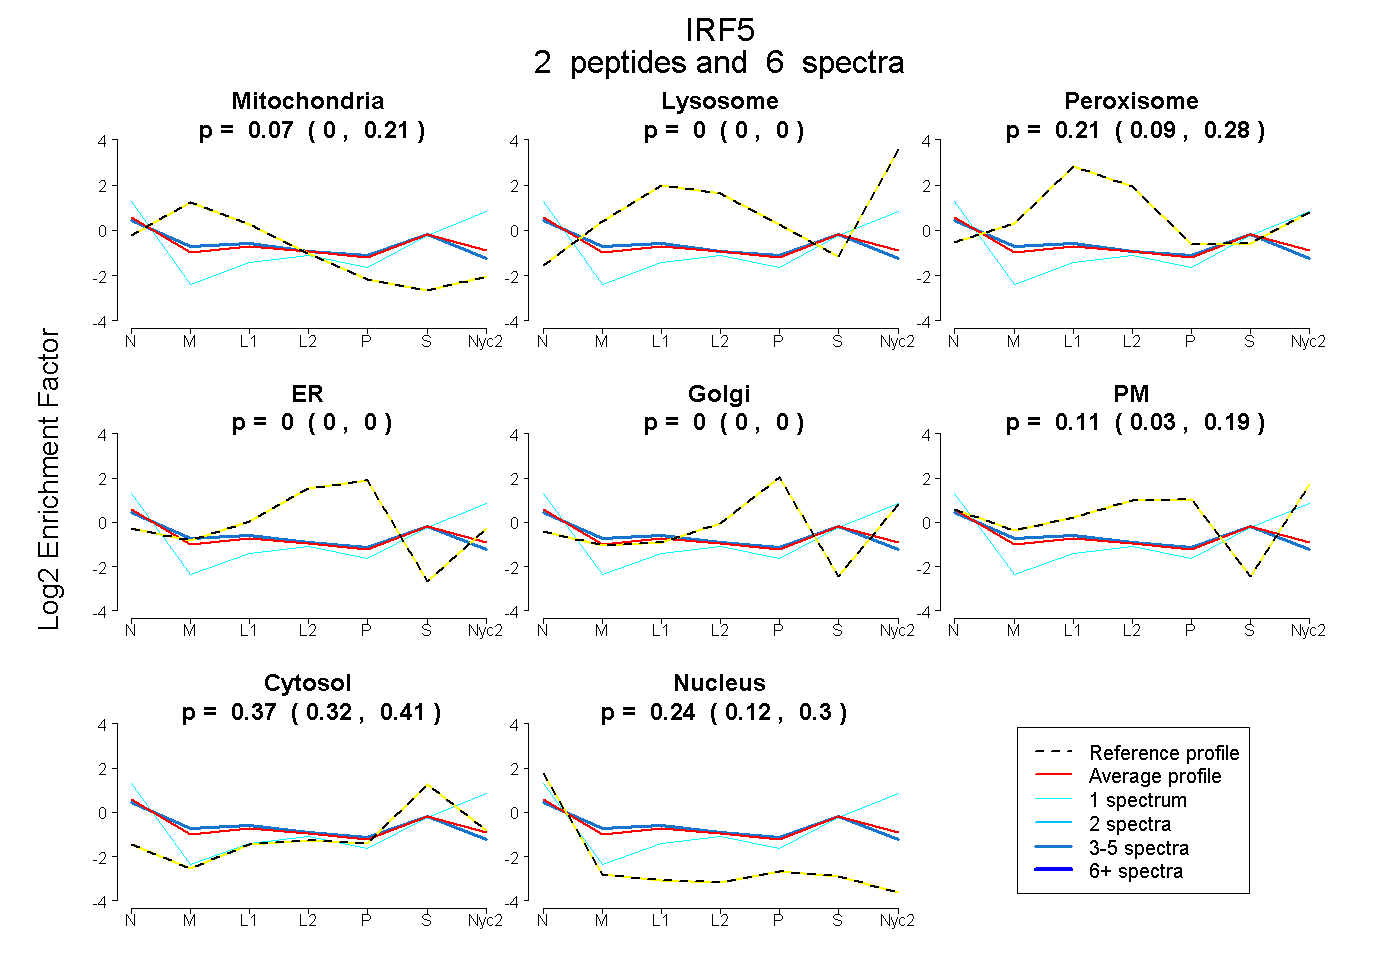
0.000 | 0.208
0.000 | 0.000
0.091 | 0.282
0.000 | 0.000
0.000 | 0.000
0.034 | 0.190
0.321 | 0.409
0.123 | 0.303
1peptide
spectra
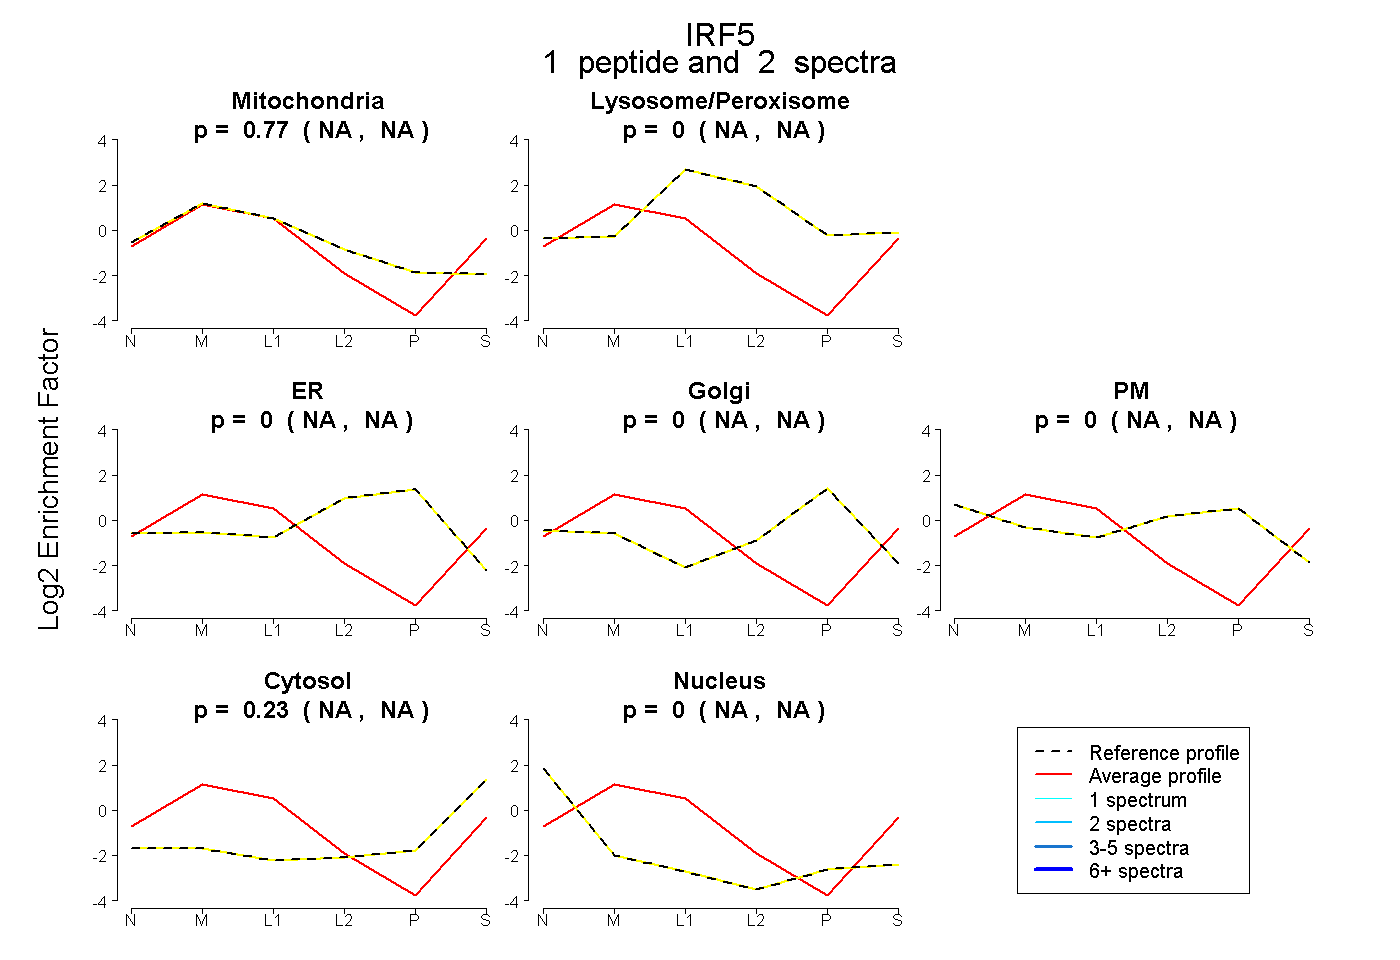
NA | NA
NA | NA
NA | NA
NA | NA
NA | NA
NA | NA
NA | NA
2peptides
spectra
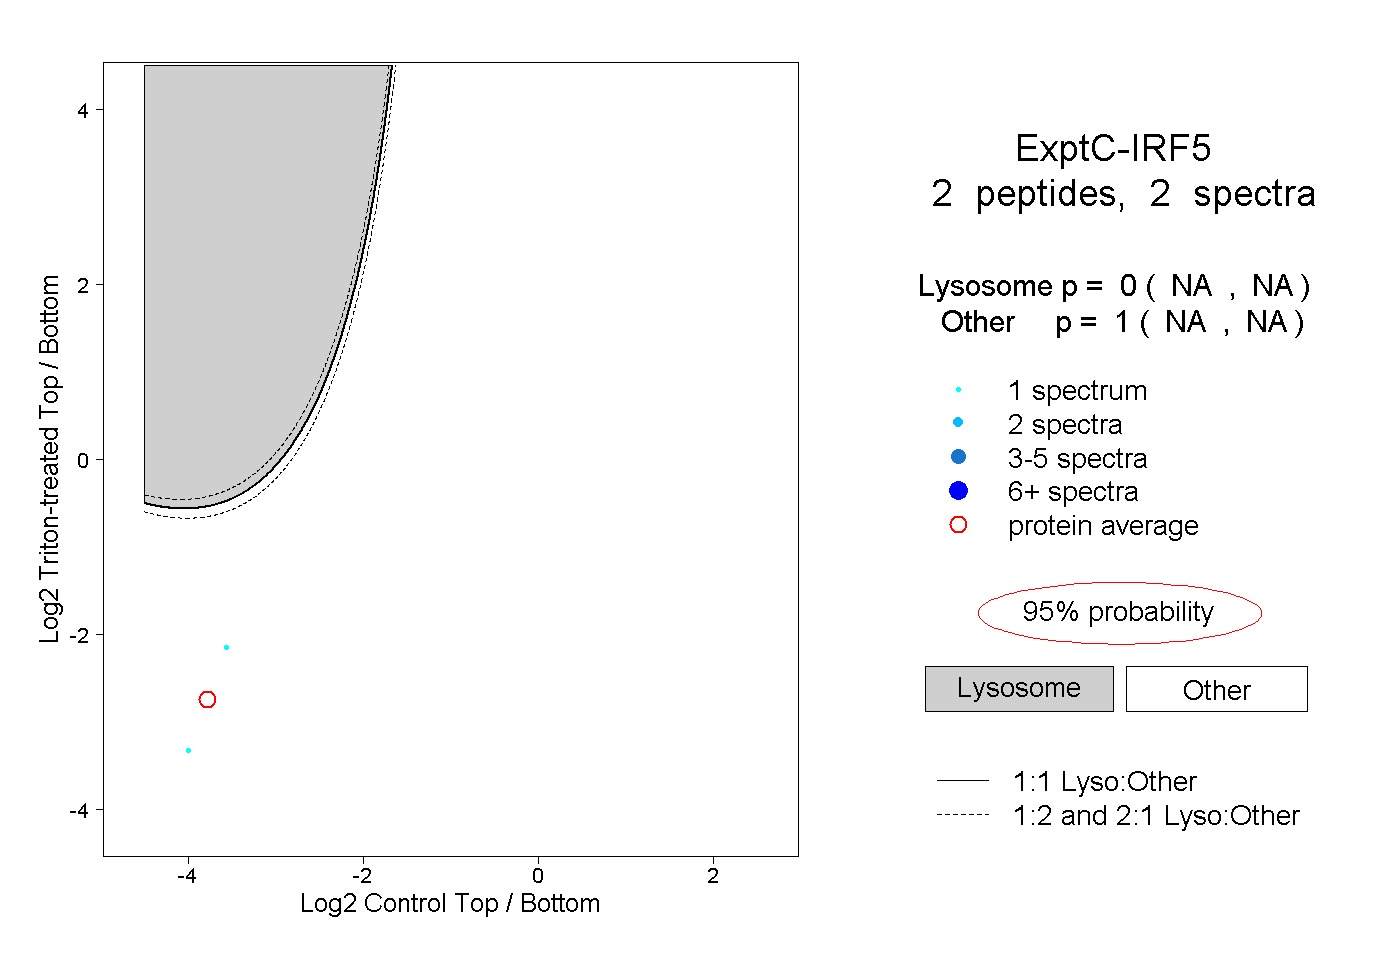
NA | NA
NA | NA