 2
2peptides
spectra
0.000 | 0.208
0.000 | 0.000
0.091 | 0.282
0.000 | 0.000
0.000 | 0.000
0.034 | 0.190
0.321 | 0.409
0.123 | 0.303
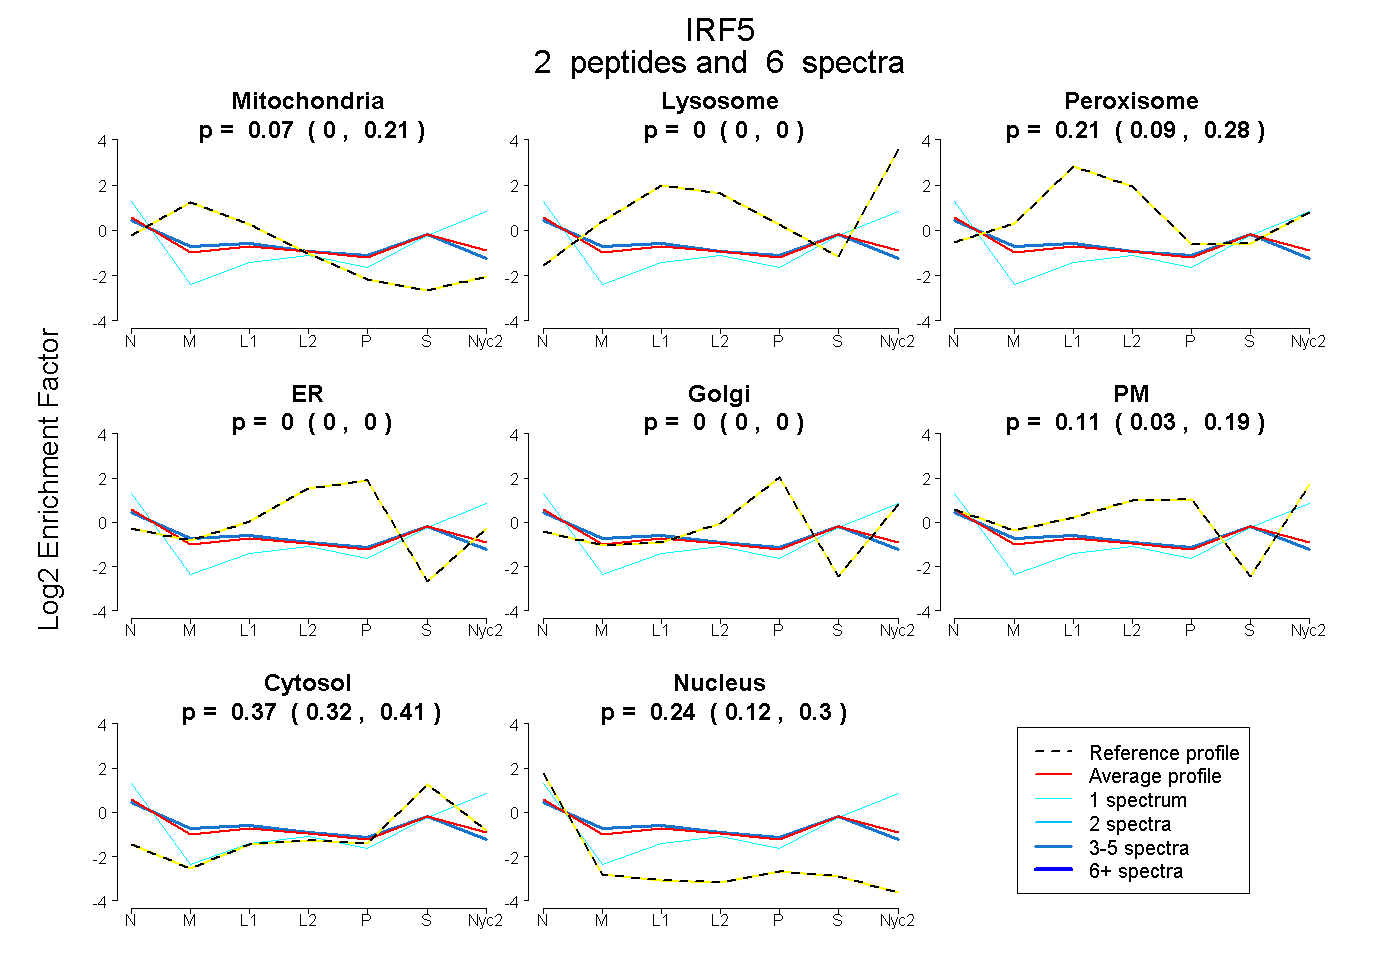
| Plot | Mito | Lyso | Perox | ER | Golgi | PM | Cytosol | Nucleus | |||||
| Expt A |
2 peptides |
6 spectra |
|
0.070 0.000 | 0.208 |
0.000 0.000 | 0.000 |
0.213 0.091 | 0.282 |
0.000 0.000 | 0.000 |
0.000 0.000 | 0.000 |
0.114 0.034 | 0.190 |
0.367 0.321 | 0.409 |
0.236 0.123 | 0.303 |
| 1 spectrum, LITVQVVPVAAR | 0.000 | 0.032 | 0.000 | 0.000 | 0.000 | 0.308 | 0.445 | 0.216 | ||
| 5 spectra, ALTISNPQGCR | 0.171 | 0.000 | 0.201 | 0.000 | 0.000 | 0.071 | 0.366 | 0.191 |
| Plot | Mito | Lyso or Perox | ER | Golgi | PM | Cytosol | Nucleus | ||||||
| Expt B |
1 peptide |
2 spectra |
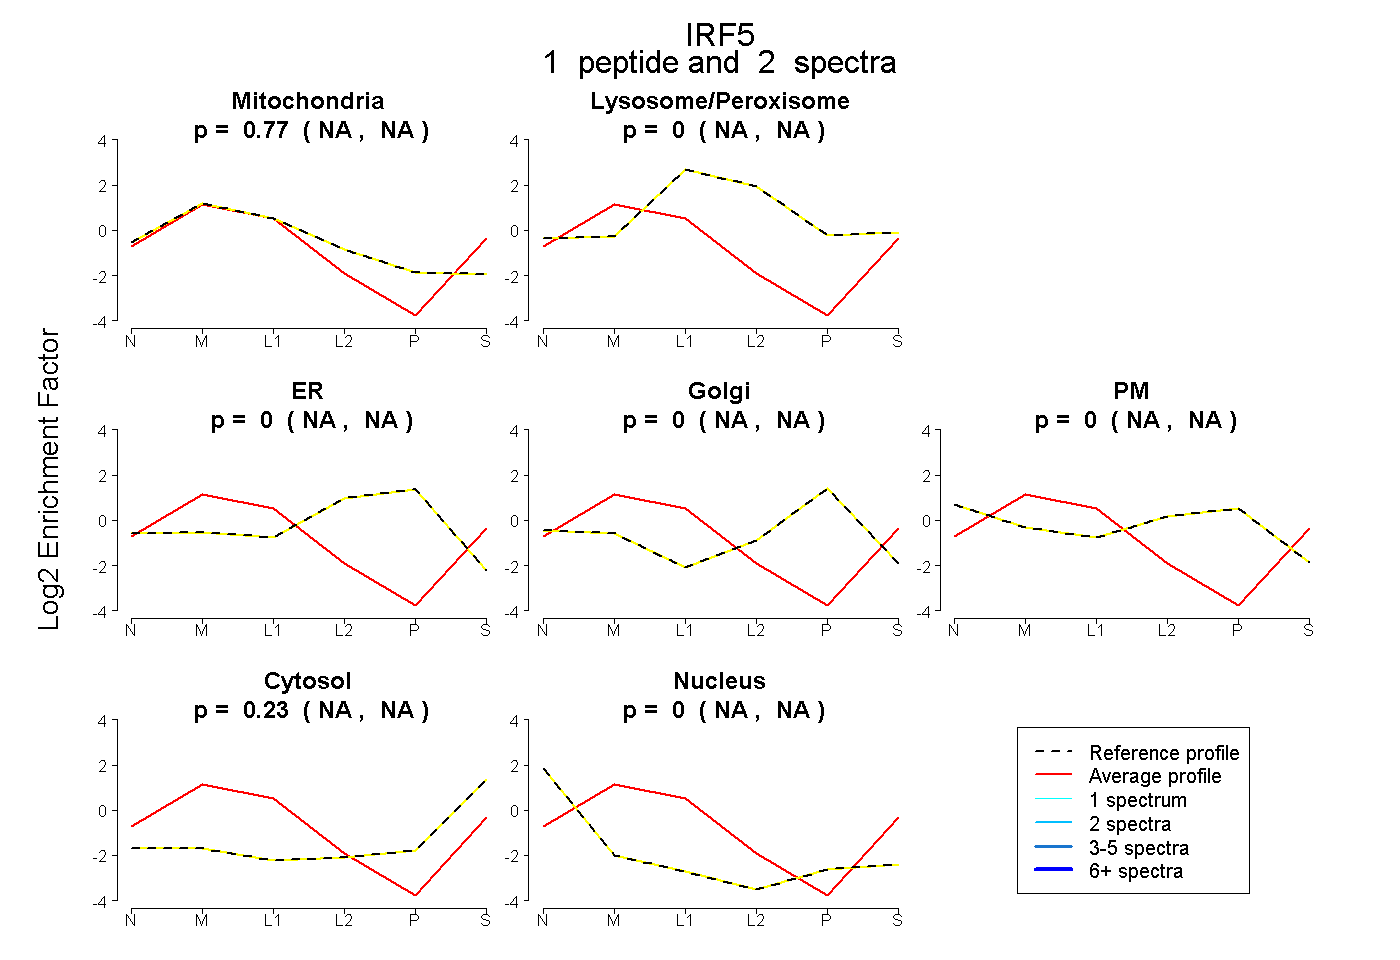 |
0.767 NA | NA |
0.000 NA | NA |
0.000 NA | NA |
0.000 NA | NA |
0.000 NA | NA |
0.233 NA | NA |
0.000 NA | NA |
|||
| Plot | Lyso | Other | |||||||||||
| Expt C |
2 peptides |
2 spectra |
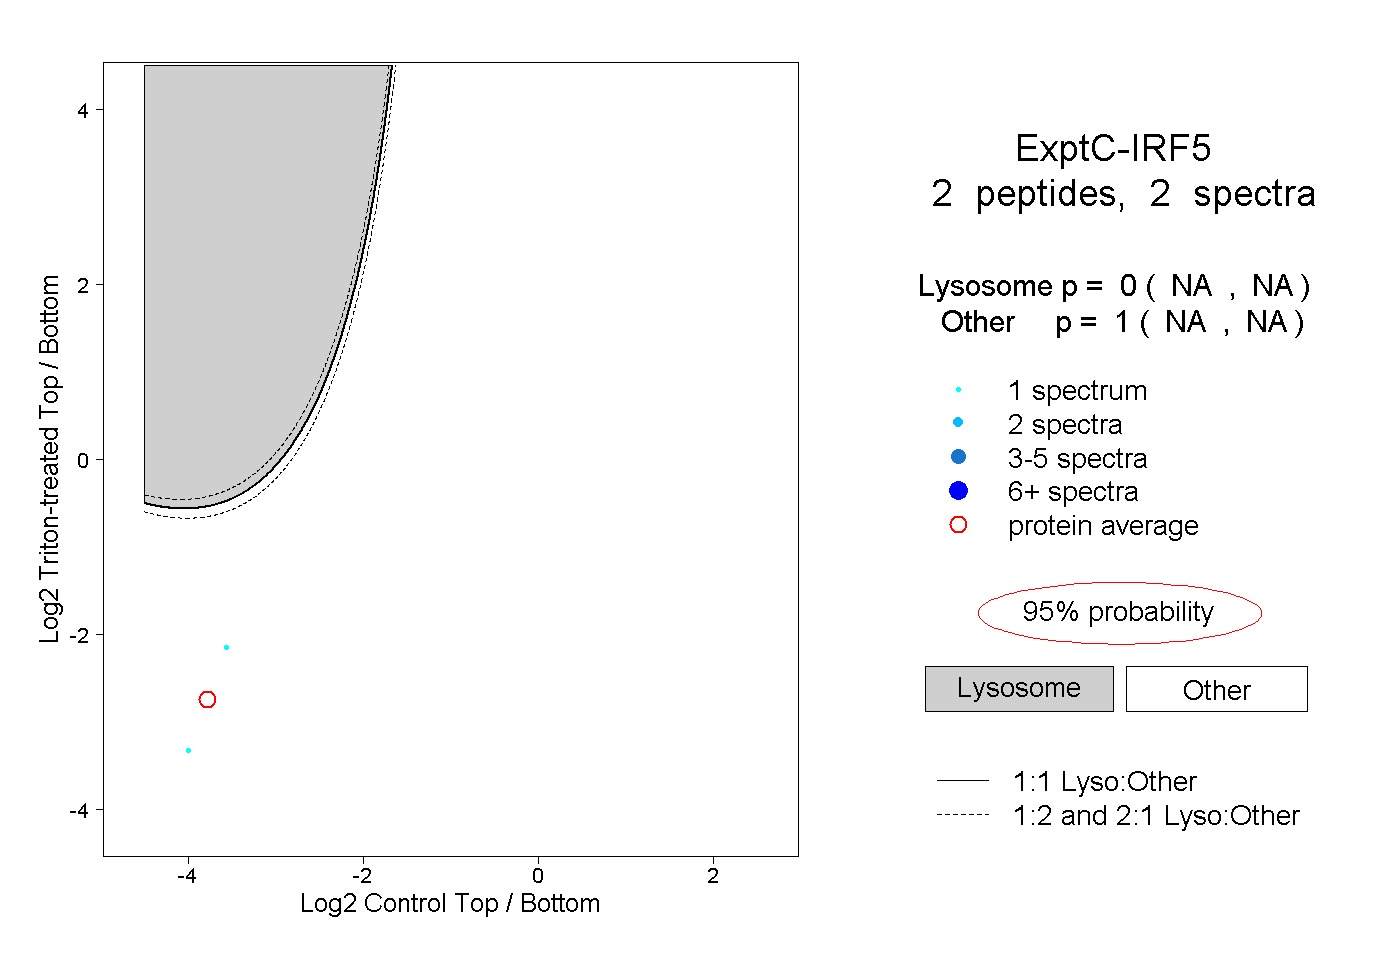 |
0.000 NA | NA |
1.000 NA | NA |