 4
4peptides
spectra
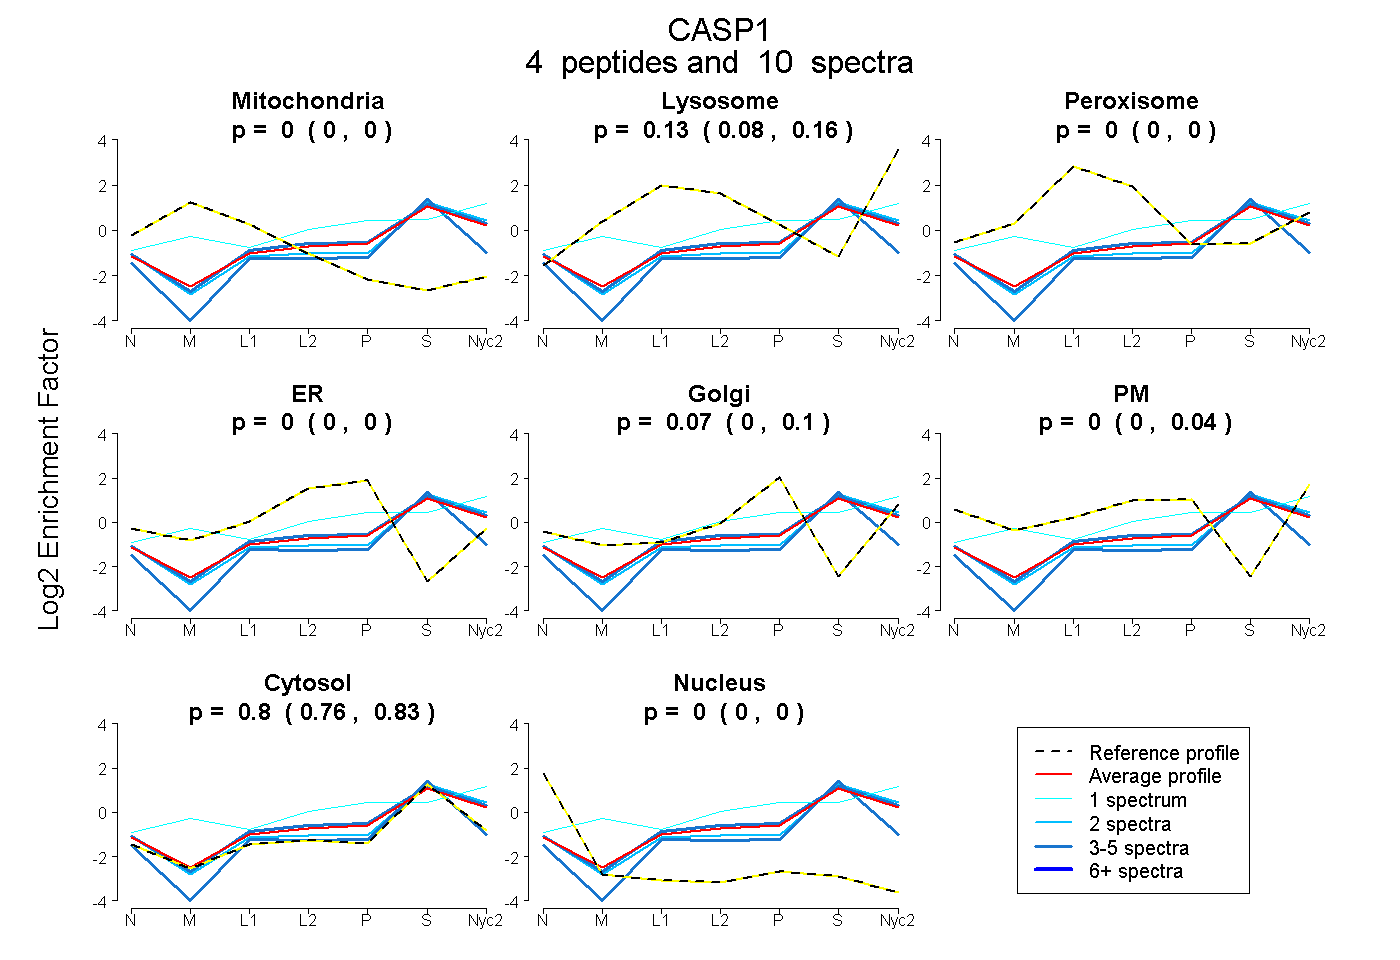
0.000 | 0.000
0.083 | 0.164
0.000 | 0.000
0.000 | 0.000
0.000 | 0.105
0.000 | 0.042
0.762 | 0.835
0.000 | 0.000
1peptide
spectra
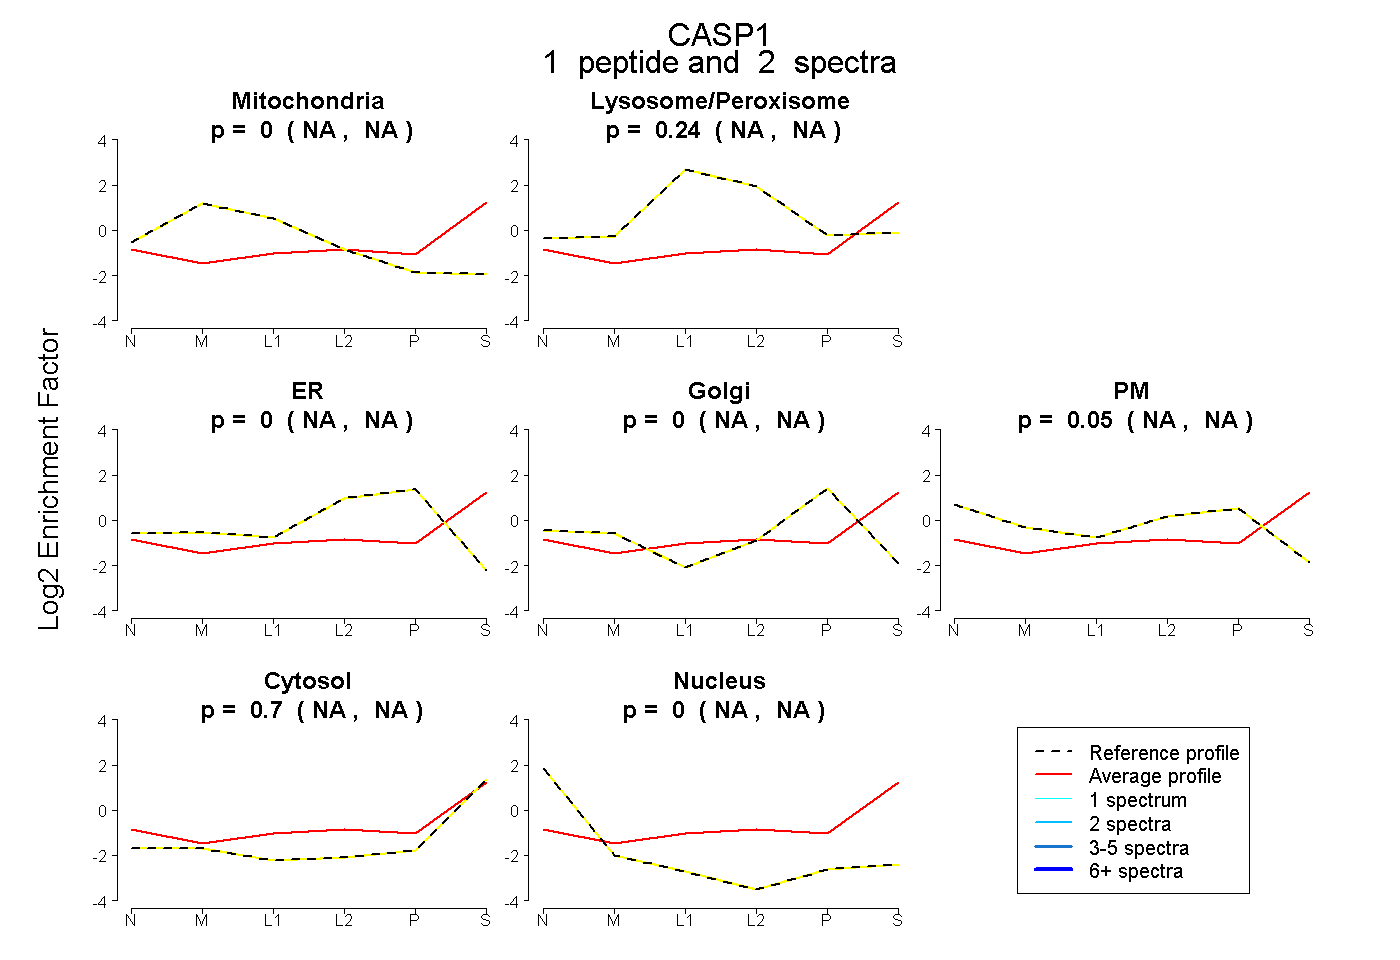
NA | NA
NA | NA
NA | NA
NA | NA
NA | NA
NA | NA
NA | NA
3peptides
spectra
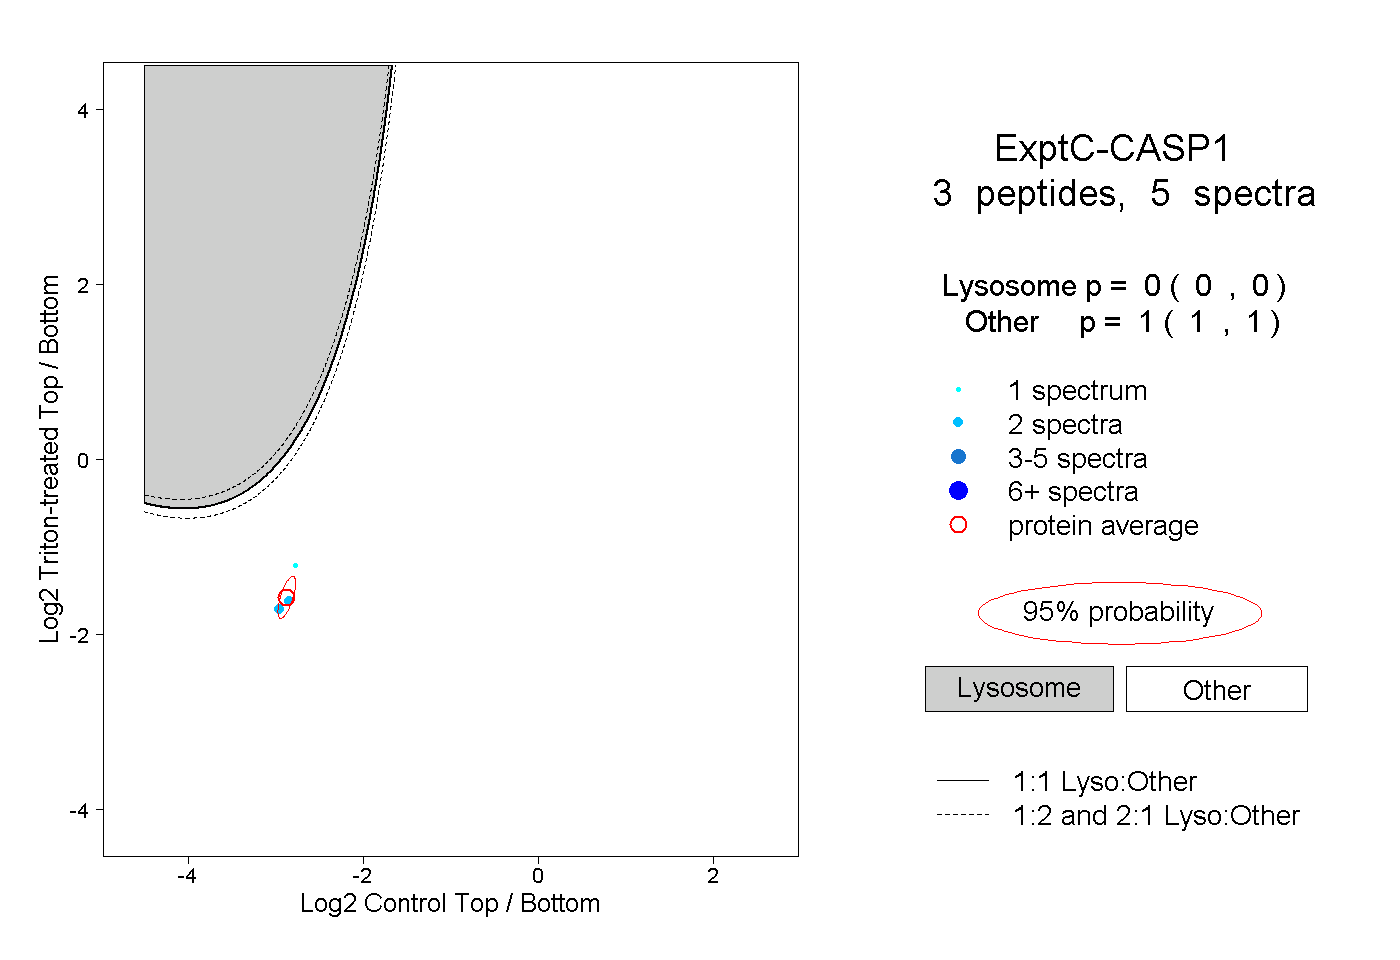
0.000 | 0.000
1.000 | 1.000