 4
4peptides
spectra
0.000 | 0.000
0.083 | 0.164
0.000 | 0.000
0.000 | 0.000
0.000 | 0.105
0.000 | 0.042
0.762 | 0.835
0.000 | 0.000
| Plot | Mito | Lyso | Perox | ER | Golgi | PM | Cytosol | Nucleus | |||||
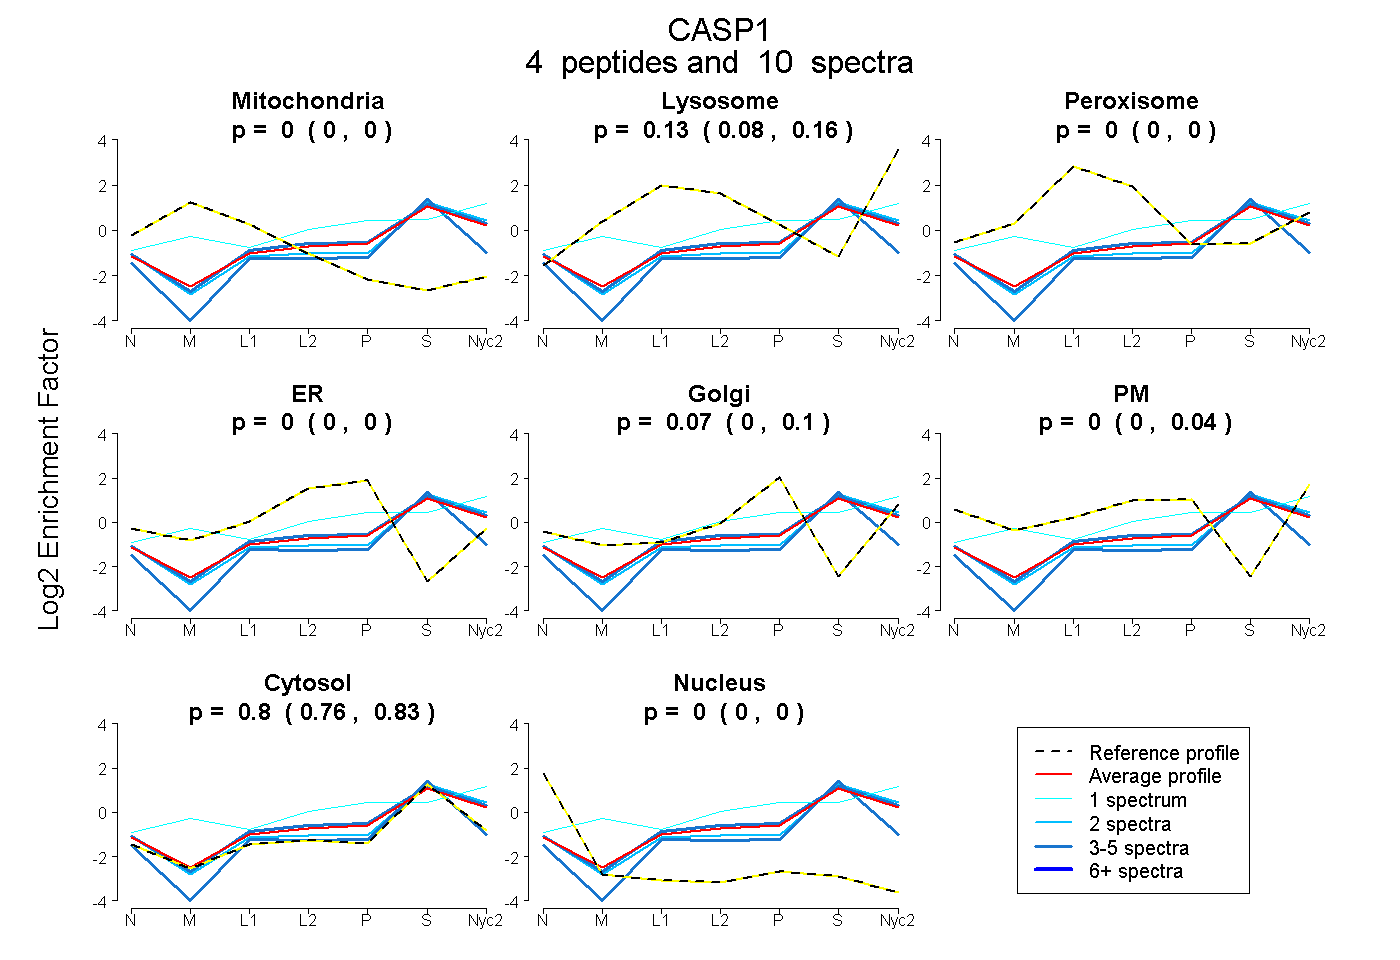
| Expt A |
4 peptides |
10 spectra |
|
0.000 0.000 | 0.000 |
0.130 0.083 | 0.164 |
0.000 0.000 | 0.000 |
0.000 0.000 | 0.000 |
0.070 0.000 | 0.105 |
0.000 0.000 | 0.042 |
0.800 0.762 | 0.835 |
0.000 0.000 | 0.000 |
| 1 spectrum, VLNQEEMDTIK | 0.000 | 0.335 | 0.000 | 0.000 | 0.238 | 0.000 | 0.427 | 0.000 | ||
| 4 spectra, VIIIQACR | 0.000 | 0.000 | 0.000 | 0.000 | 0.000 | 0.000 | 1.000 | 0.000 | ||
| 3 spectra, LQMPTTER | 0.000 | 0.149 | 0.000 | 0.000 | 0.051 | 0.003 | 0.797 | 0.000 | ||
| 2 spectra, FSFEQPDSR | 0.000 | 0.126 | 0.000 | 0.000 | 0.000 | 0.000 | 0.874 | 0.000 |
| Plot | Mito | Lyso or Perox | ER | Golgi | PM | Cytosol | Nucleus | ||||||
| Expt B |
1 peptide |
2 spectra |
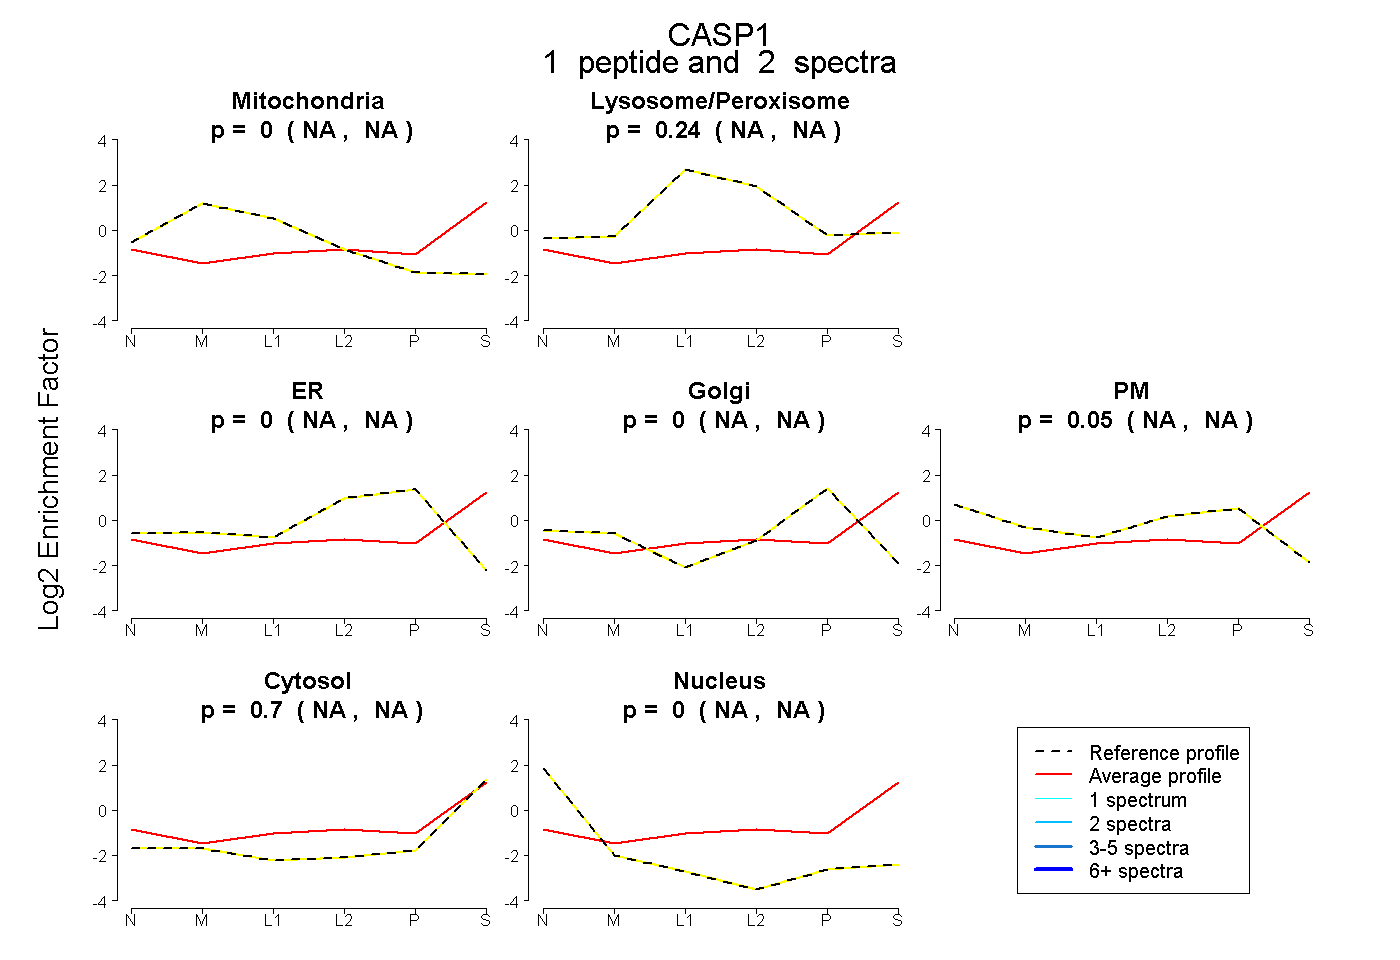 |
0.000 NA | NA |
0.245 NA | NA |
0.000 NA | NA |
0.000 NA | NA |
0.054 NA | NA |
0.702 NA | NA |
0.000 NA | NA |
|||
| Plot | Lyso | Other | |||||||||||
| Expt C |
3 peptides |
5 spectra |
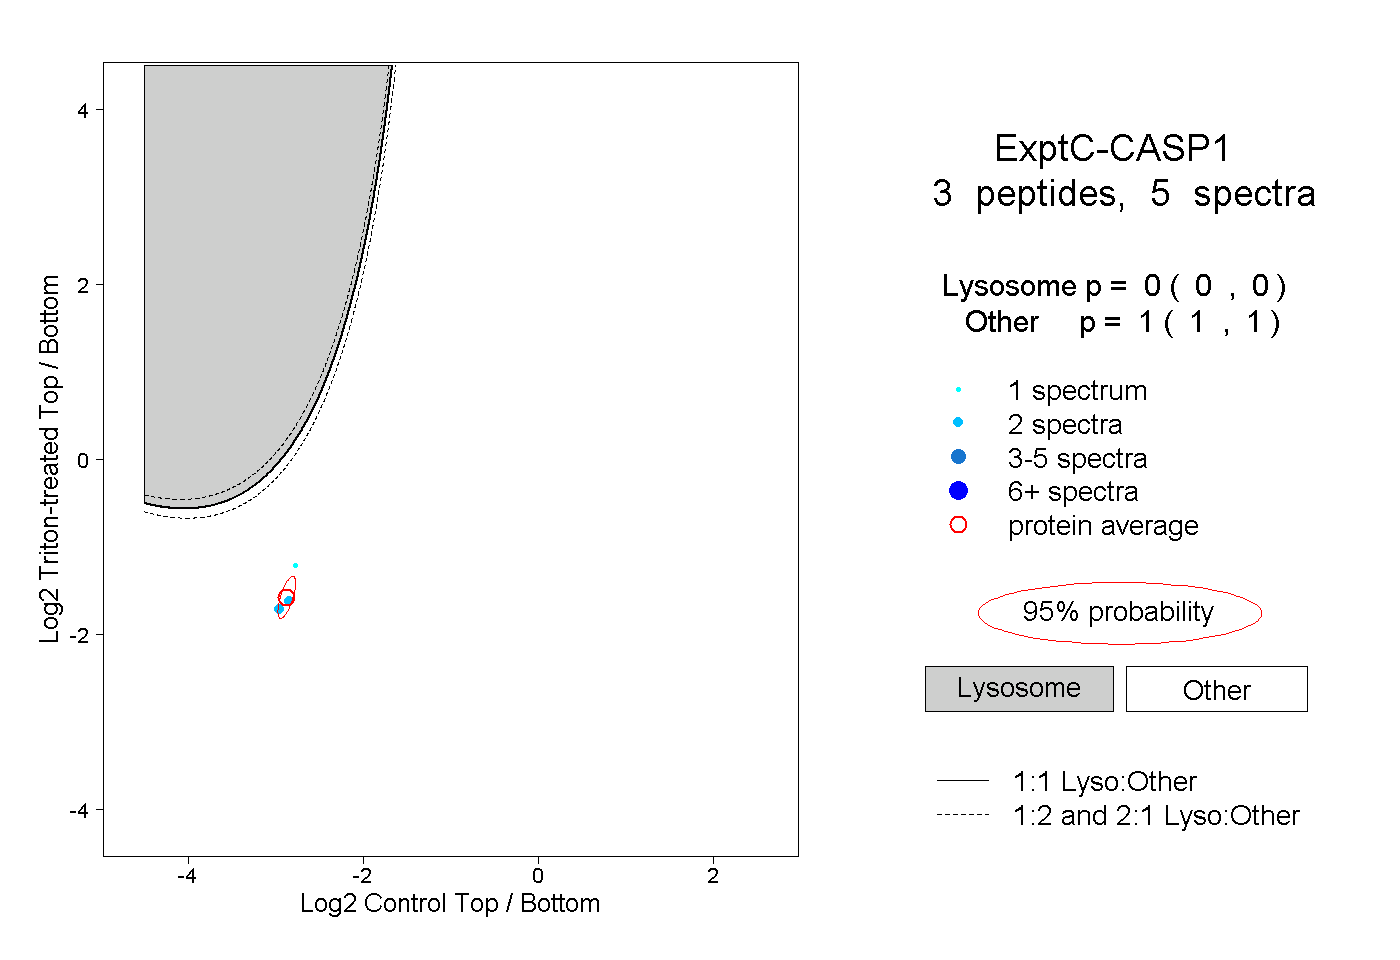 |
0.000 0.000 | 0.000 |
1.000 1.000 | 1.000 |