 13
13peptides
spectra
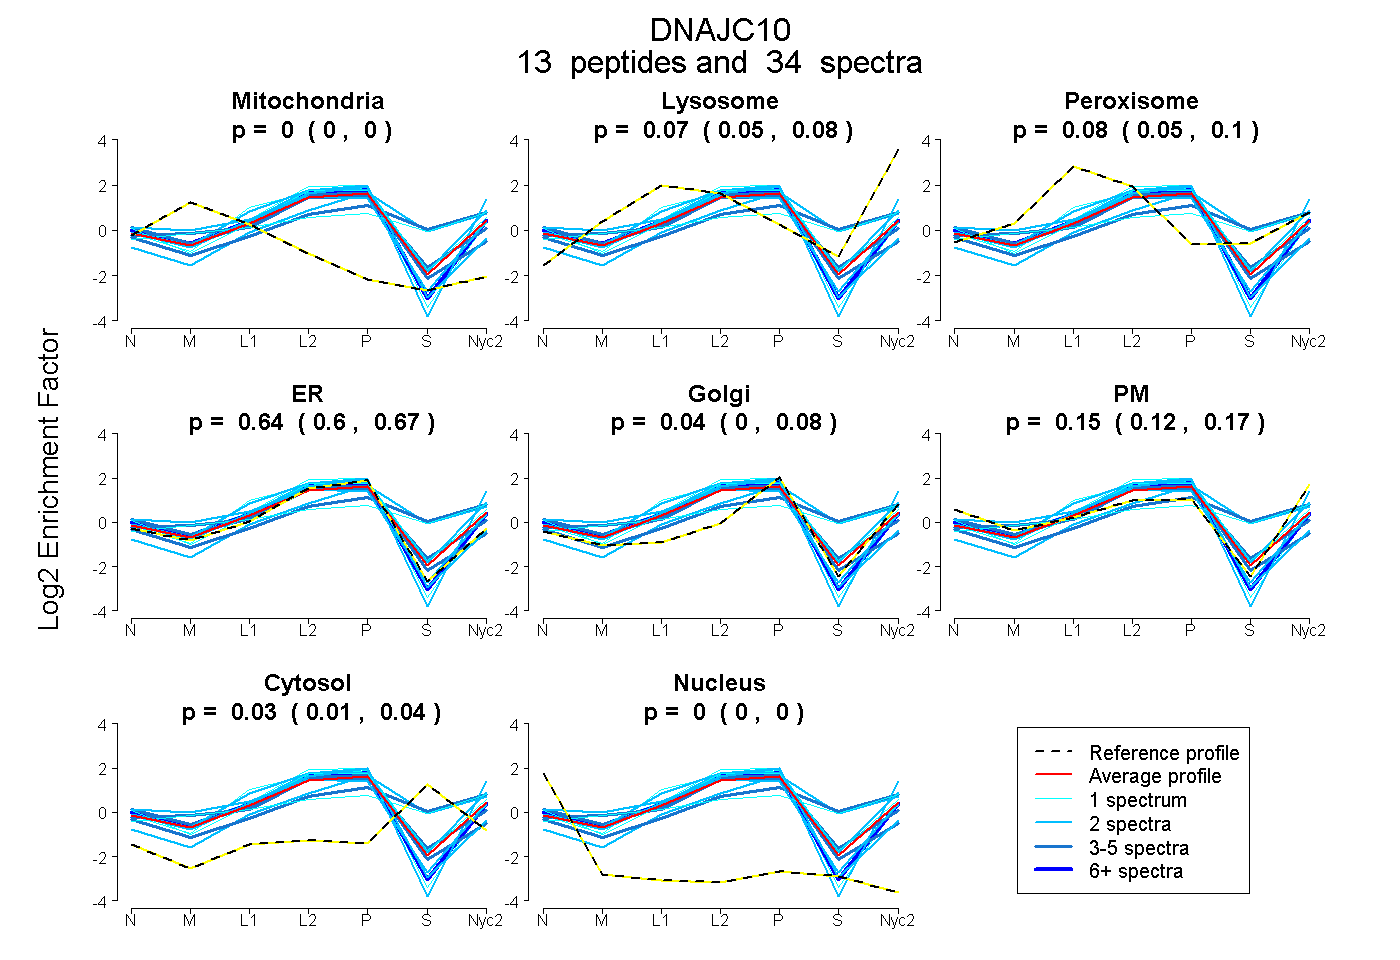
0.000 | 0.000
0.047 | 0.083
0.047 | 0.102
0.602 | 0.670
0.000 | 0.084
0.119 | 0.173
0.014 | 0.041
0.000 | 0.000
1peptide
spectrum
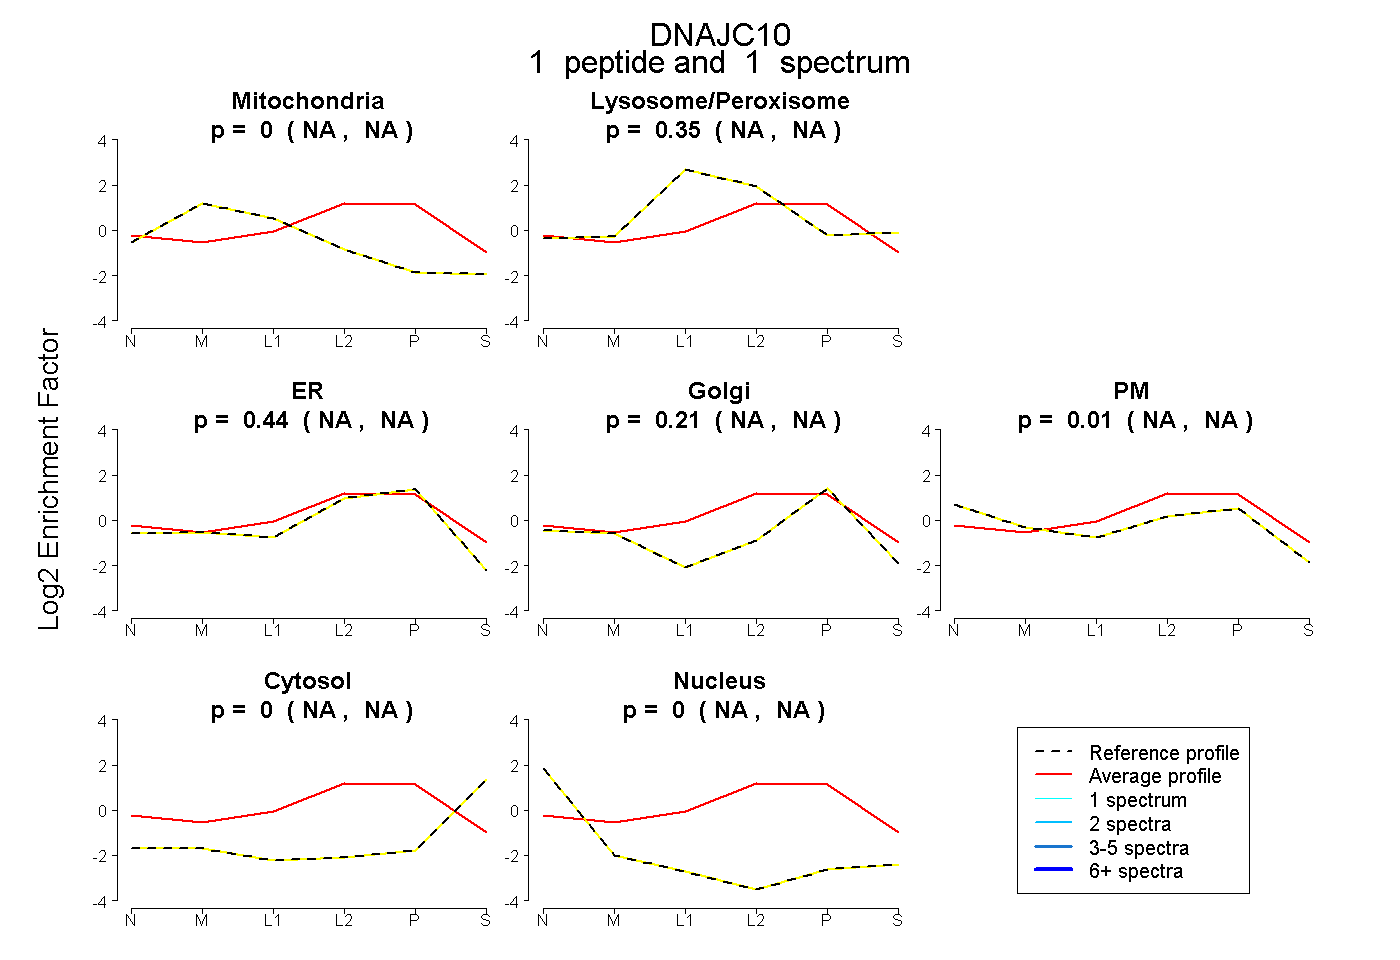
NA | NA
NA | NA
NA | NA
NA | NA
NA | NA
NA | NA
NA | NA
16peptides
spectra
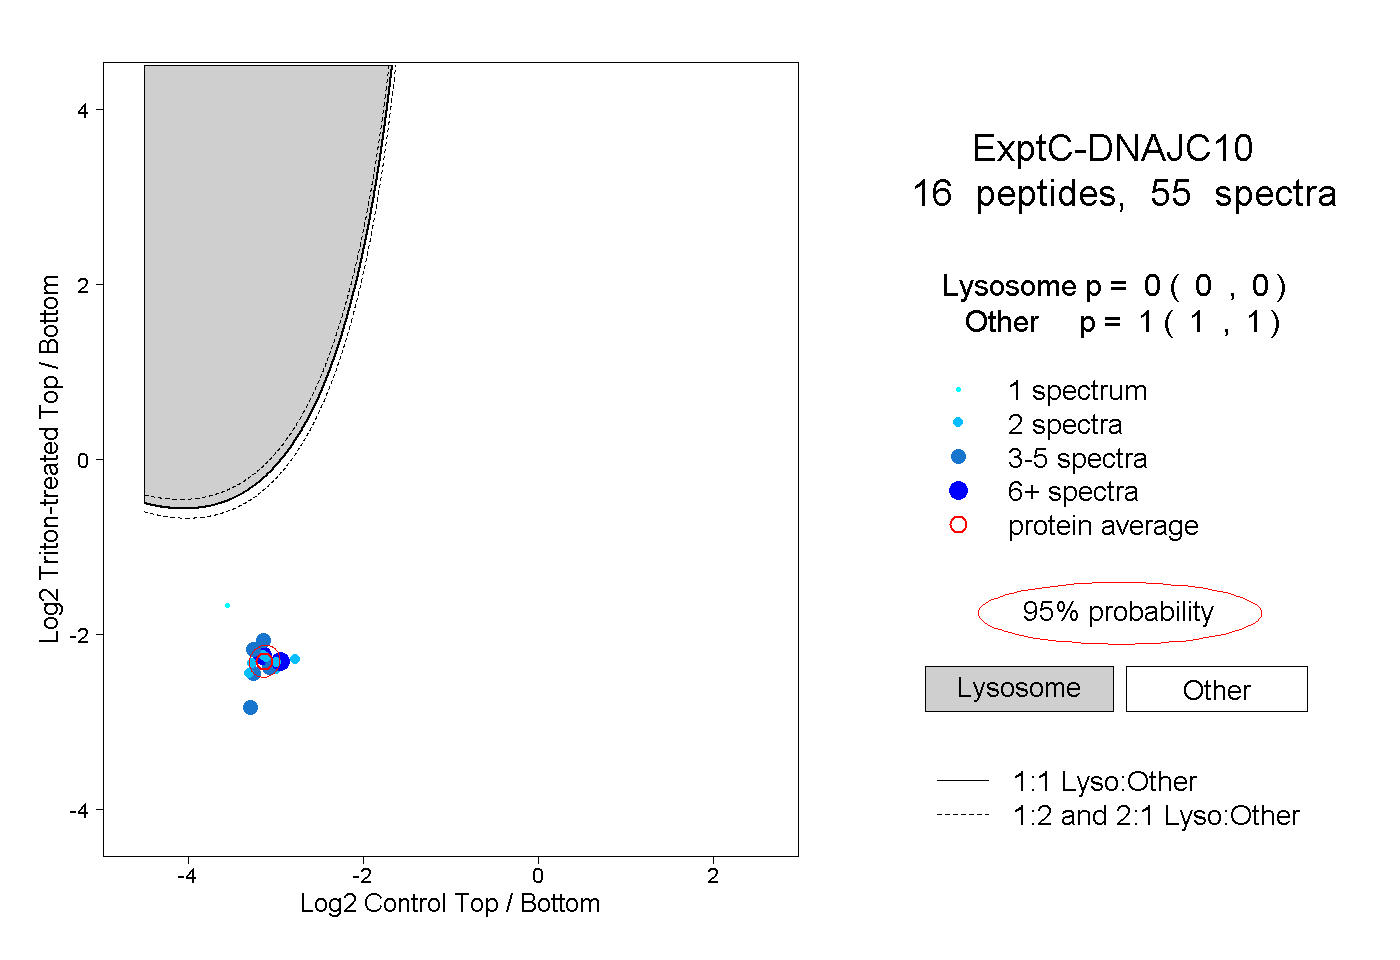
0.000 | 0.000
1.000 | 1.000
1peptide
spectra
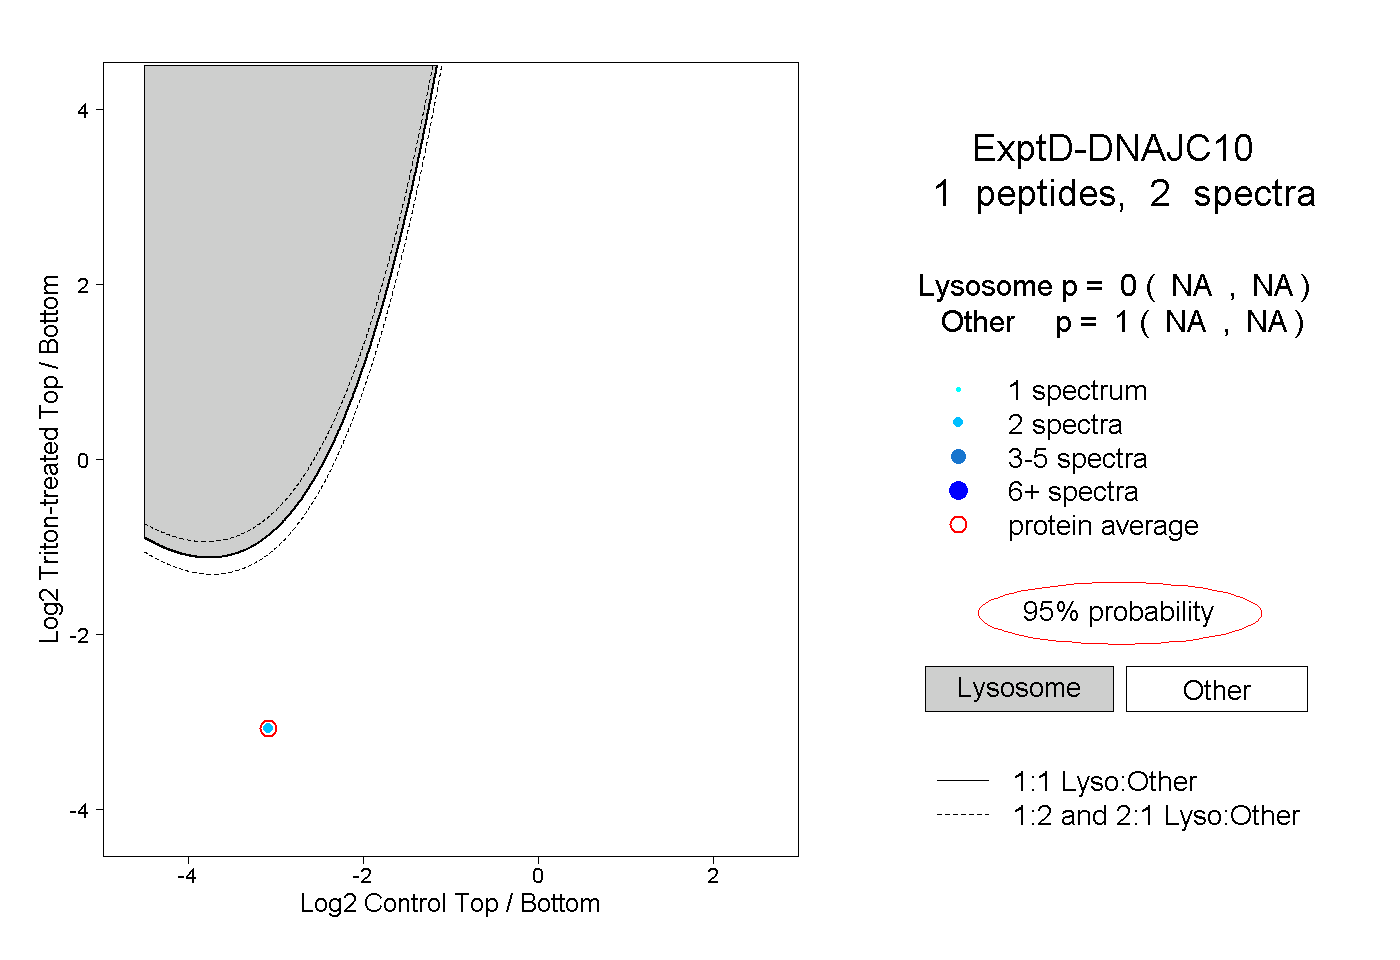
NA | NA
NA | NA