 13
13peptides
spectra
0.000 | 0.000
0.047 | 0.083
0.047 | 0.102
0.602 | 0.670
0.000 | 0.084
0.119 | 0.173
0.014 | 0.041
0.000 | 0.000
| Plot | Mito | Lyso | Perox | ER | Golgi | PM | Cytosol | Nucleus | |||||
| Expt A |
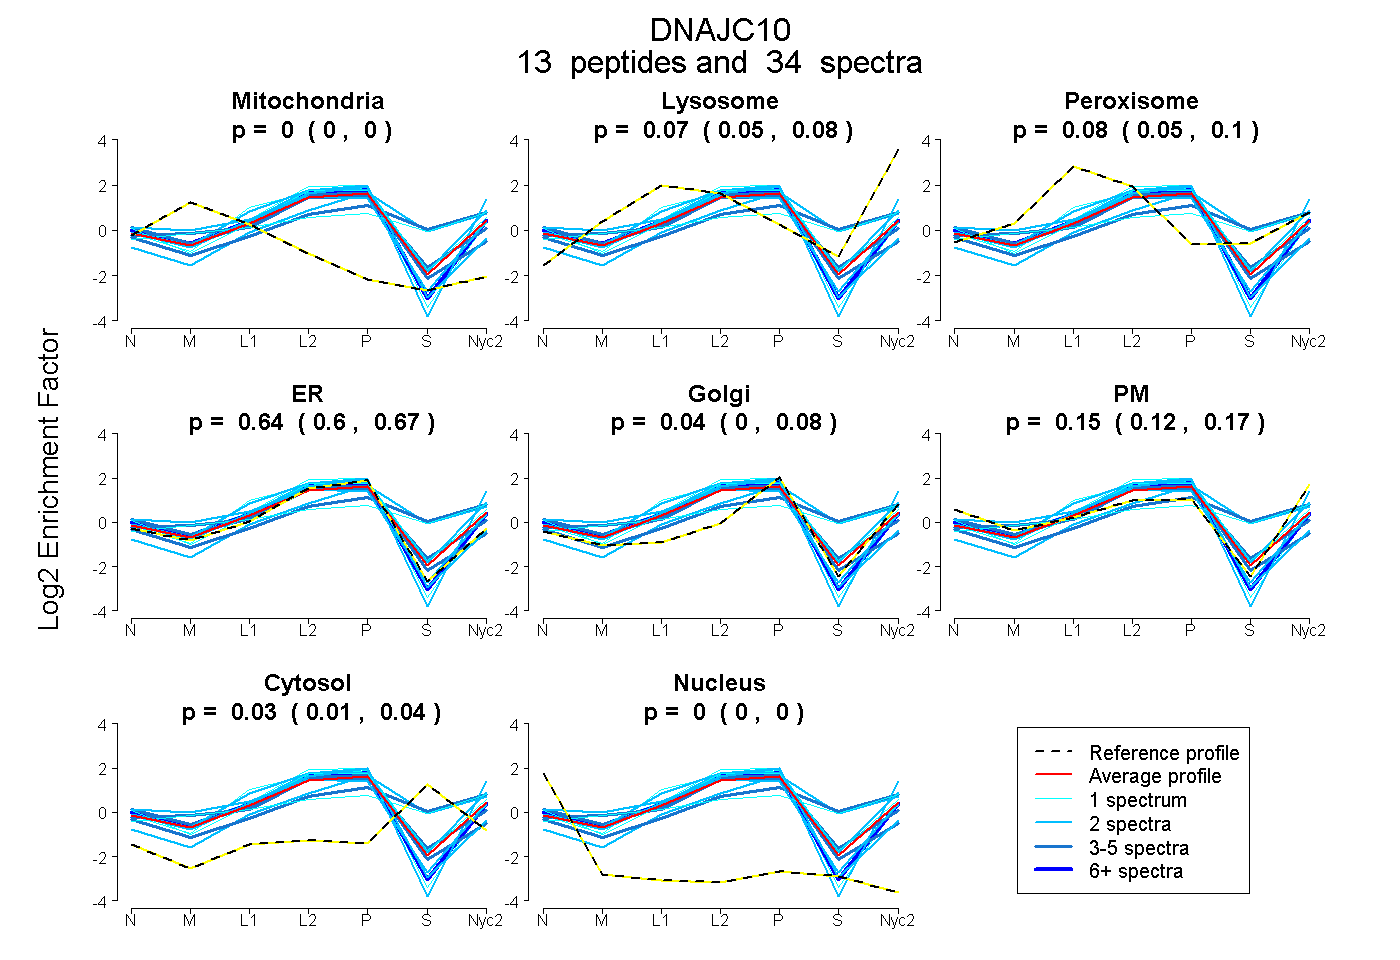
13 peptides |
34 spectra |
|
0.000 0.000 | 0.000 |
0.067 0.047 | 0.083 |
0.075 0.047 | 0.102 |
0.640 0.602 | 0.670 |
0.039 0.000 | 0.084 |
0.150 0.119 | 0.173 |
0.029 0.014 | 0.041 |
0.000 0.000 | 0.000 |
| 4 spectra, IGAVNCGDDR | 0.000 | 0.000 | 0.193 | 0.615 | 0.112 | 0.045 | 0.036 | 0.000 | ||
| 2 spectra, GVNSYPSLFIFR | 0.000 | 0.089 | 0.000 | 0.512 | 0.000 | 0.399 | 0.000 | 0.000 | ||
| 1 spectrum, TIAALIYGK | 0.000 | 0.003 | 0.104 | 0.703 | 0.000 | 0.157 | 0.033 | 0.000 | ||
| 4 spectra, GEDCLTPQTR | 0.000 | 0.000 | 0.107 | 0.862 | 0.000 | 0.000 | 0.000 | 0.032 | ||
| 2 spectra, SSVLFLNSLDAK | 0.037 | 0.000 | 0.083 | 0.536 | 0.000 | 0.343 | 0.000 | 0.000 | ||
| 2 spectra, VDCQAYPQTCQK | 0.000 | 0.000 | 0.006 | 0.994 | 0.000 | 0.000 | 0.000 | 0.000 | ||
| 1 spectrum, SLDATASTTAYFPPGATLNNK | 0.000 | 0.119 | 0.284 | 0.000 | 0.313 | 0.052 | 0.233 | 0.000 | ||
| 1 spectrum, EYEIHHGK | 0.000 | 0.132 | 0.125 | 0.708 | 0.000 | 0.035 | 0.000 | 0.000 | ||
| 2 spectra, SIWEEQINSR | 0.000 | 0.196 | 0.000 | 0.654 | 0.000 | 0.148 | 0.002 | 0.000 | ||
| 1 spectrum, ASTLLYGQLK | 0.000 | 0.056 | 0.000 | 0.851 | 0.000 | 0.093 | 0.000 | 0.000 | ||
| 3 spectra, ESLVSFAMQHVR | 0.000 | 0.189 | 0.000 | 0.225 | 0.076 | 0.164 | 0.347 | 0.000 | ||
| 2 spectra, AYPSVK | 0.000 | 0.213 | 0.000 | 0.330 | 0.152 | 0.000 | 0.304 | 0.000 | ||
| 9 spectra, DAYSLR | 0.000 | 0.012 | 0.000 | 0.712 | 0.000 | 0.275 | 0.000 | 0.000 |
| Plot | Mito | Lyso or Perox | ER | Golgi | PM | Cytosol | Nucleus | ||||||
| Expt B |
1 peptide |
1 spectrum |
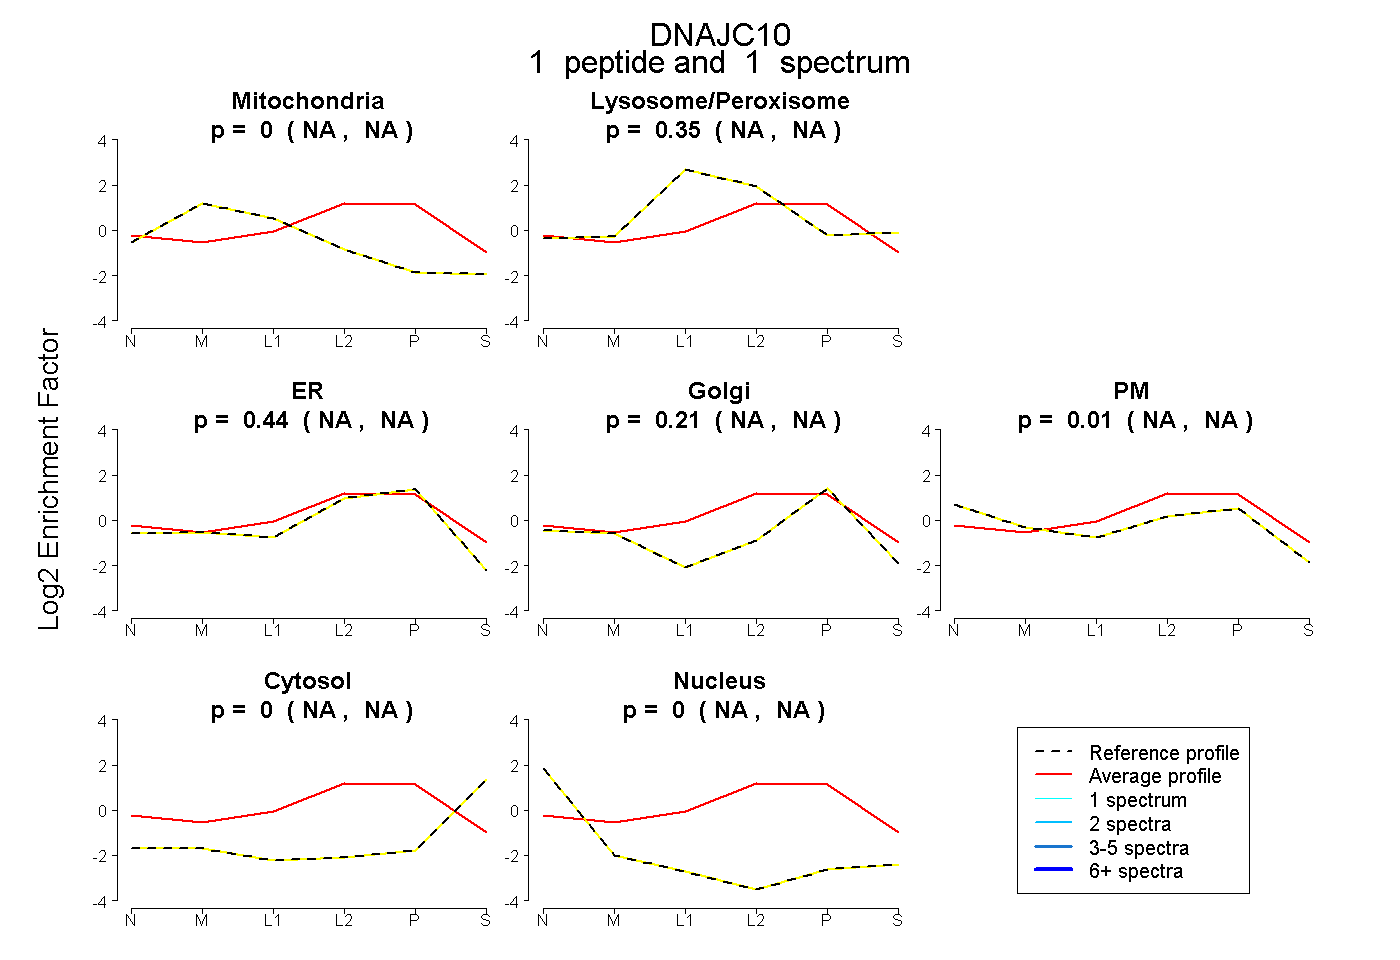 |
0.000 NA | NA |
0.346 NA | NA |
0.438 NA | NA |
0.210 NA | NA |
0.006 NA | NA |
0.000 NA | NA |
0.000 NA | NA |
|||
| Plot | Lyso | Other | |||||||||||
| Expt C |
16 peptides |
55 spectra |
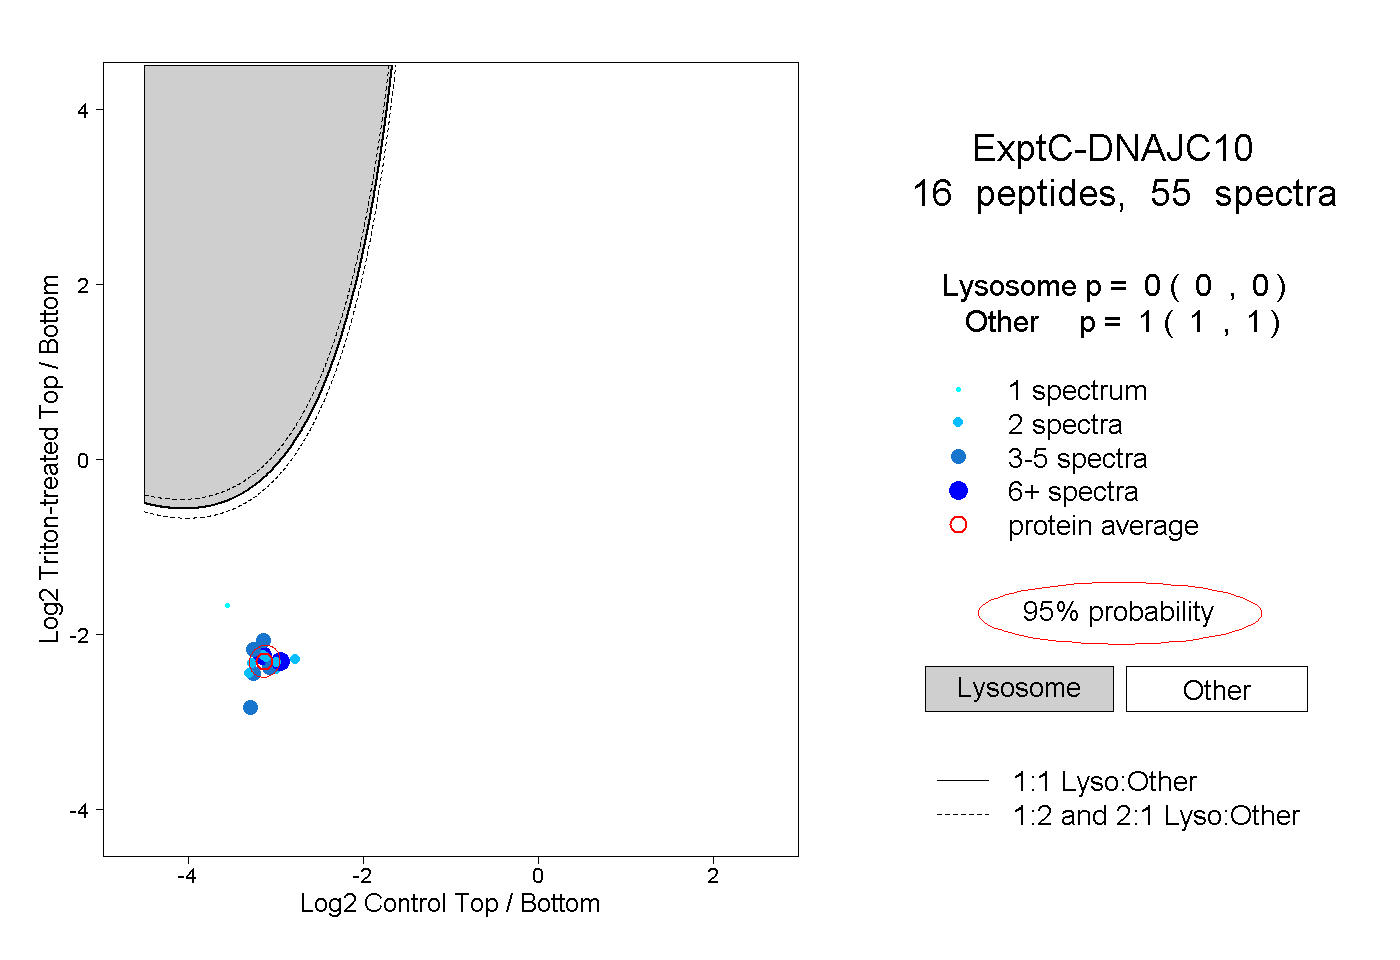 |
0.000 0.000 | 0.000 |
1.000 1.000 | 1.000 |
||||||||
| Plot | Lyso | Other | |||||||||||
| Expt D |
1 peptide |
2 spectra |
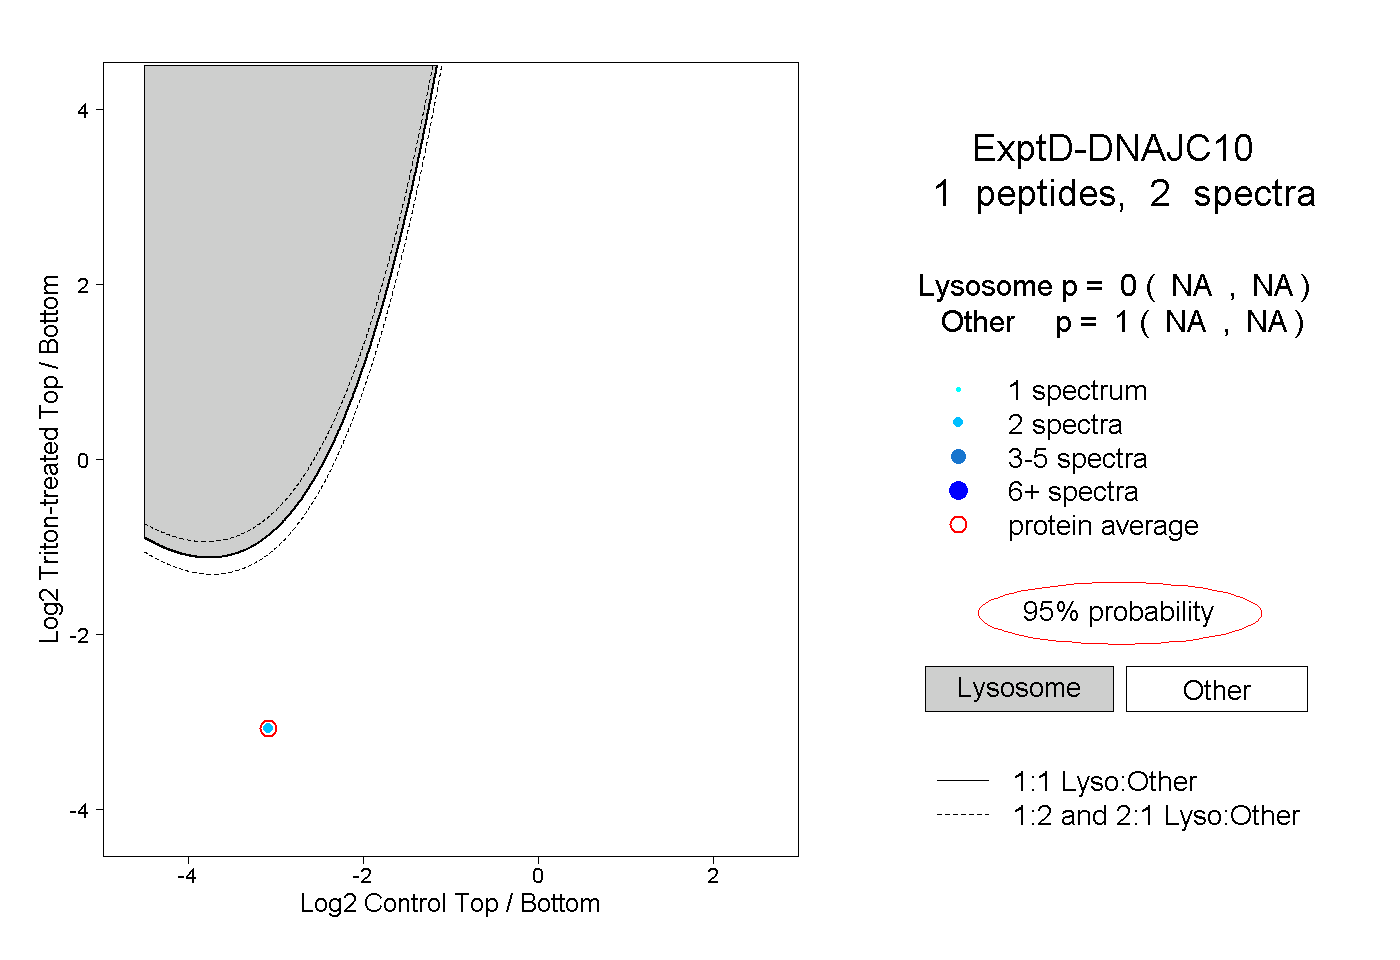 |
0.000 NA | NA |
1.000 NA | NA |