 12
12peptides
spectra
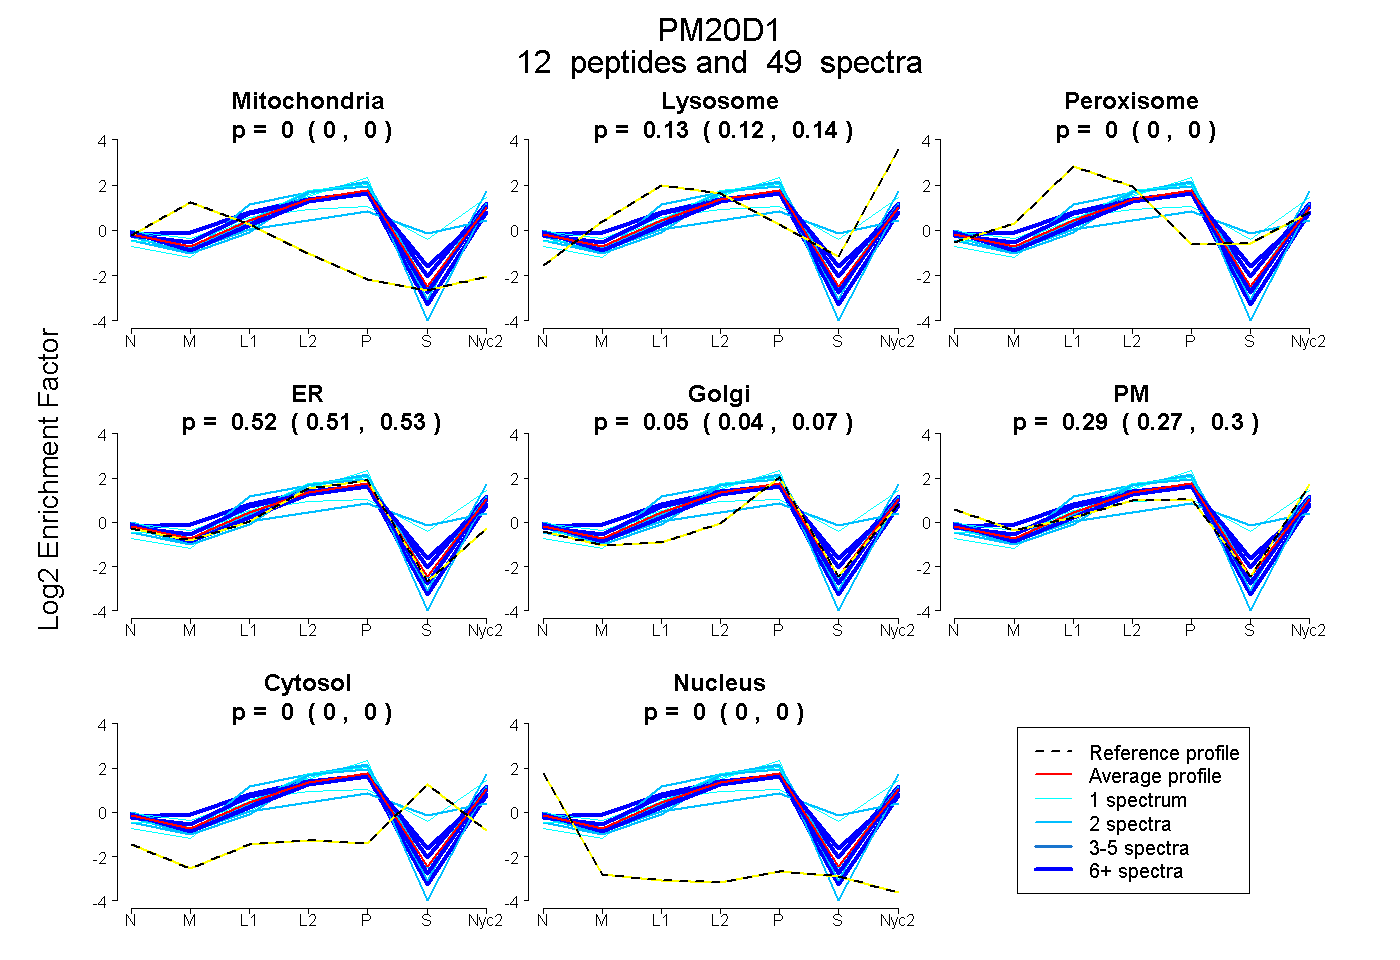
0.000 | 0.000
0.123 | 0.143
0.000 | 0.000
0.510 | 0.535
0.038 | 0.066
0.272 | 0.304
0.000 | 0.000
0.000 | 0.000
9peptides
spectra
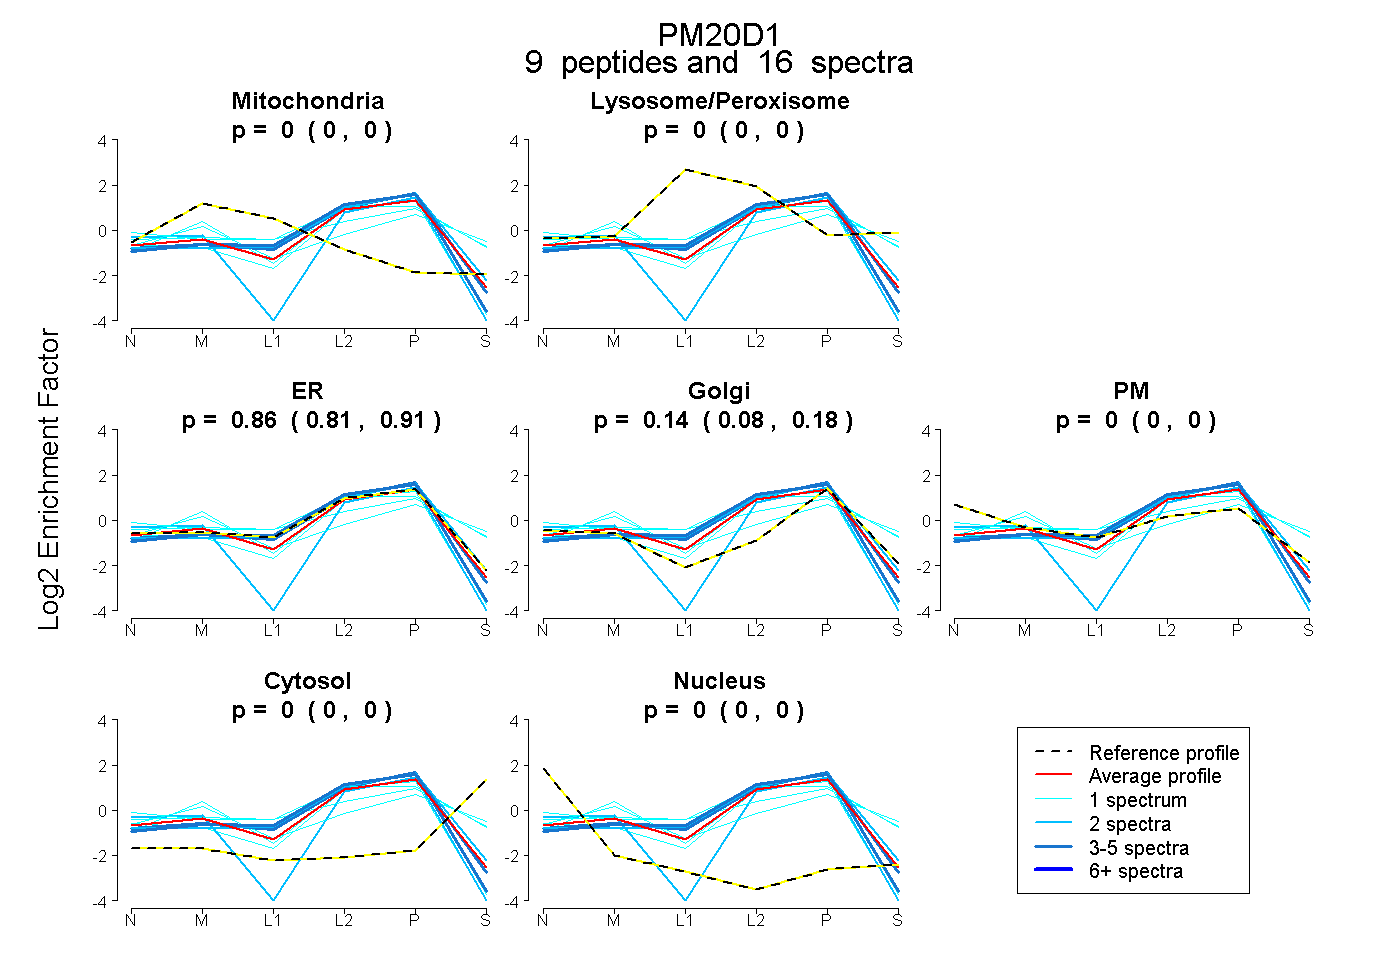
0.000 | 0.000
0.000 | 0.000
0.809 | 0.908
0.082 | 0.181
0.000 | 0.000
0.000 | 0.000
0.000 | 0.000
11peptides
spectra
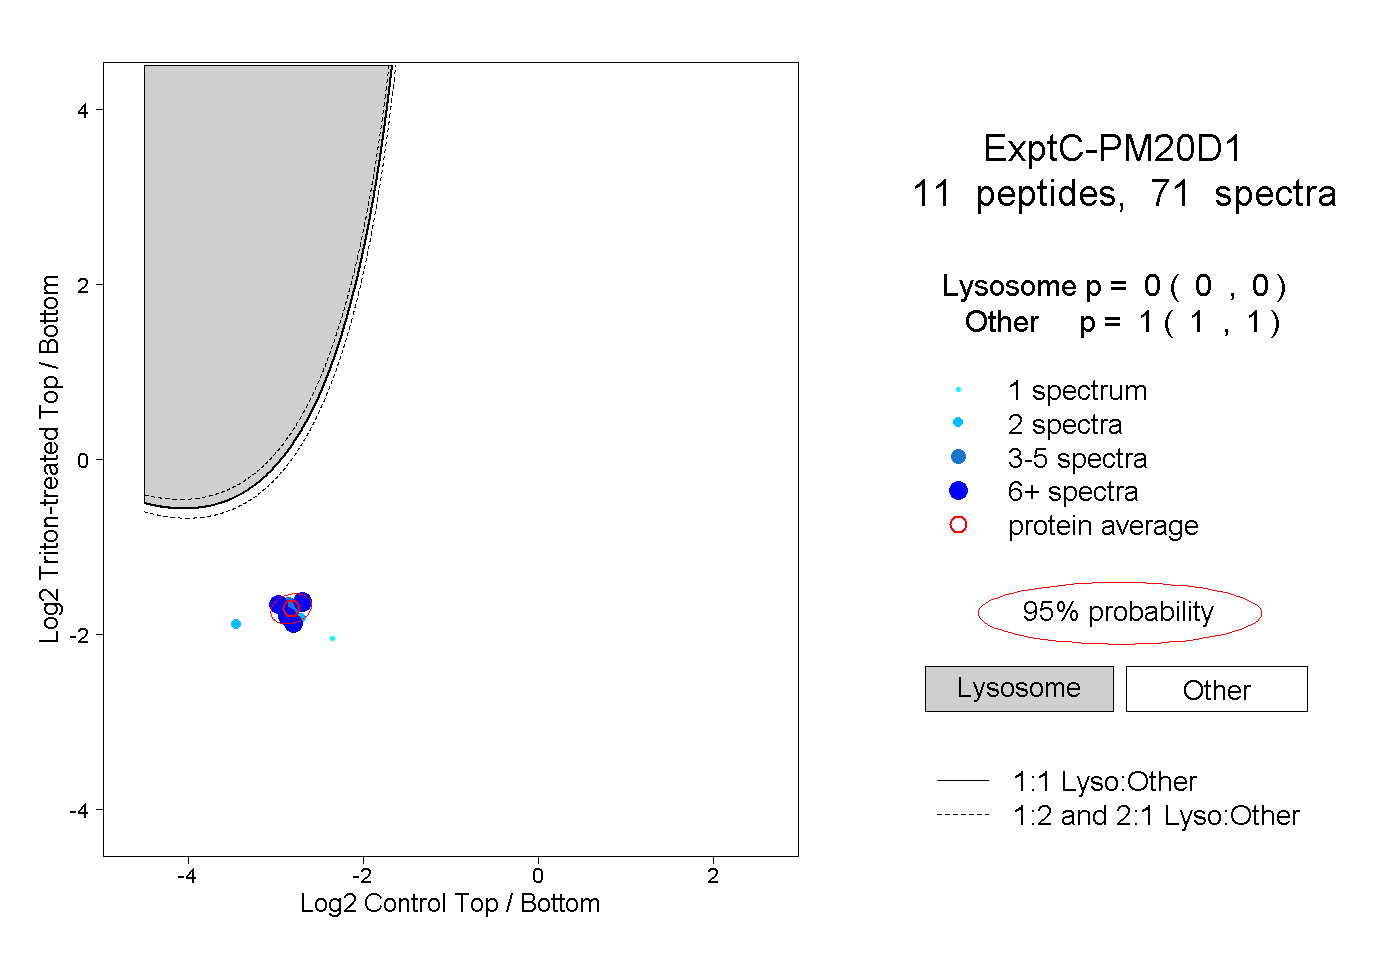
0.000 | 0.000
1.000 | 1.000
4peptides
spectra
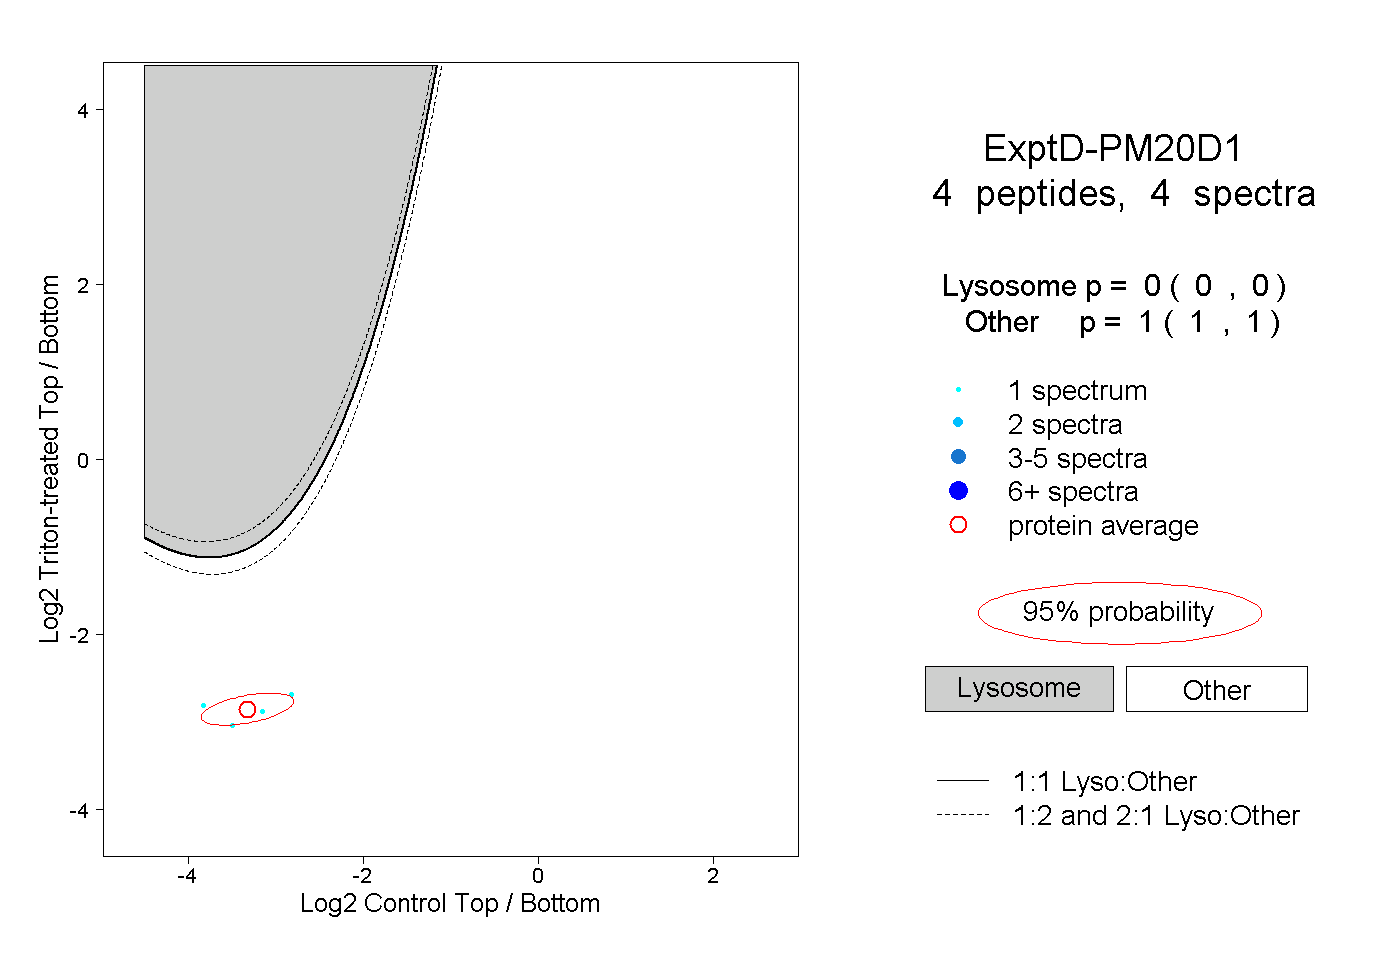
0.000 | 0.000
1.000 | 1.000