 12
12peptides
spectra
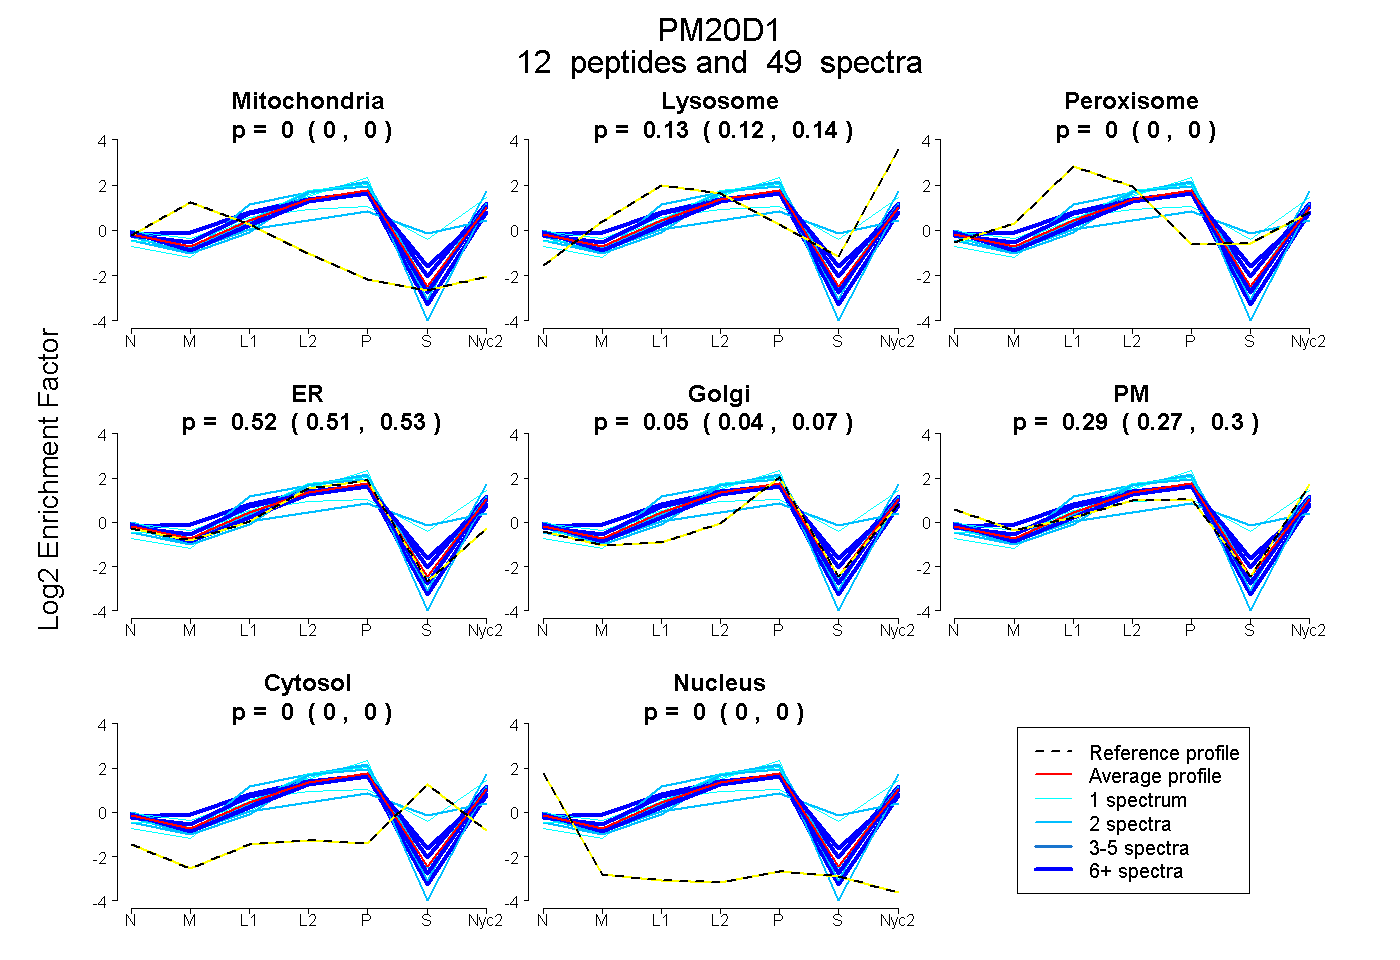
0.000 | 0.000
0.123 | 0.143
0.000 | 0.000
0.510 | 0.535
0.038 | 0.066
0.272 | 0.304
0.000 | 0.000
0.000 | 0.000
| Plot | Mito | Lyso | Perox | ER | Golgi | PM | Cytosol | Nucleus | |||||
| Expt A |
12 peptides |
49 spectra |
|
0.000 0.000 | 0.000 |
0.134 0.123 | 0.143 |
0.000 0.000 | 0.000 |
0.523 0.510 | 0.535 |
0.052 0.038 | 0.066 |
0.290 0.272 | 0.304 |
0.000 0.000 | 0.000 |
0.000 0.000 | 0.000 |
| 2 spectra, VNVIPPLAQATVNFR | 0.000 | 0.000 | 0.240 | 0.047 | 0.246 | 0.178 | 0.289 | 0.000 | ||
| 8 spectra, GALDNK | 0.000 | 0.141 | 0.000 | 0.396 | 0.143 | 0.319 | 0.000 | 0.000 | ||
| 2 spectra, KPFAMISVTEK | 0.000 | 0.096 | 0.000 | 0.371 | 0.000 | 0.532 | 0.000 | 0.000 | ||
| 1 spectrum, FNPVFLKPQDFSSVHGINEK | 0.000 | 0.141 | 0.000 | 0.712 | 0.063 | 0.084 | 0.000 | 0.000 | ||
| 1 spectrum, TTTALTMFNAGIK | 0.000 | 0.196 | 0.000 | 0.673 | 0.000 | 0.131 | 0.000 | 0.000 | ||
| 2 spectra, ISVESYQNQVK | 0.000 | 0.096 | 0.000 | 0.670 | 0.000 | 0.234 | 0.000 | 0.000 | ||
| 13 spectra, VQLHVLR | 0.000 | 0.128 | 0.000 | 0.504 | 0.039 | 0.244 | 0.085 | 0.000 | ||
| 1 spectrum, ETSIGILSAAVSR | 0.000 | 0.000 | 0.000 | 0.569 | 0.054 | 0.376 | 0.000 | 0.000 | ||
| 6 spectra, GAQQISALLQTR | 0.005 | 0.113 | 0.000 | 0.588 | 0.000 | 0.293 | 0.000 | 0.000 | ||
| 10 spectra, YSHLLTVR | 0.000 | 0.149 | 0.000 | 0.548 | 0.000 | 0.303 | 0.000 | 0.000 | ||
| 2 spectra, NPITNALVR | 0.000 | 0.147 | 0.000 | 0.538 | 0.235 | 0.079 | 0.000 | 0.000 | ||
| 1 spectrum, RPFFIALGHDEEVSGTK | 0.000 | 0.181 | 0.205 | 0.000 | 0.166 | 0.303 | 0.144 | 0.000 |
| Plot | Mito | Lyso or Perox | ER | Golgi | PM | Cytosol | Nucleus | ||||||
| Expt B |
9 peptides |
16 spectra |
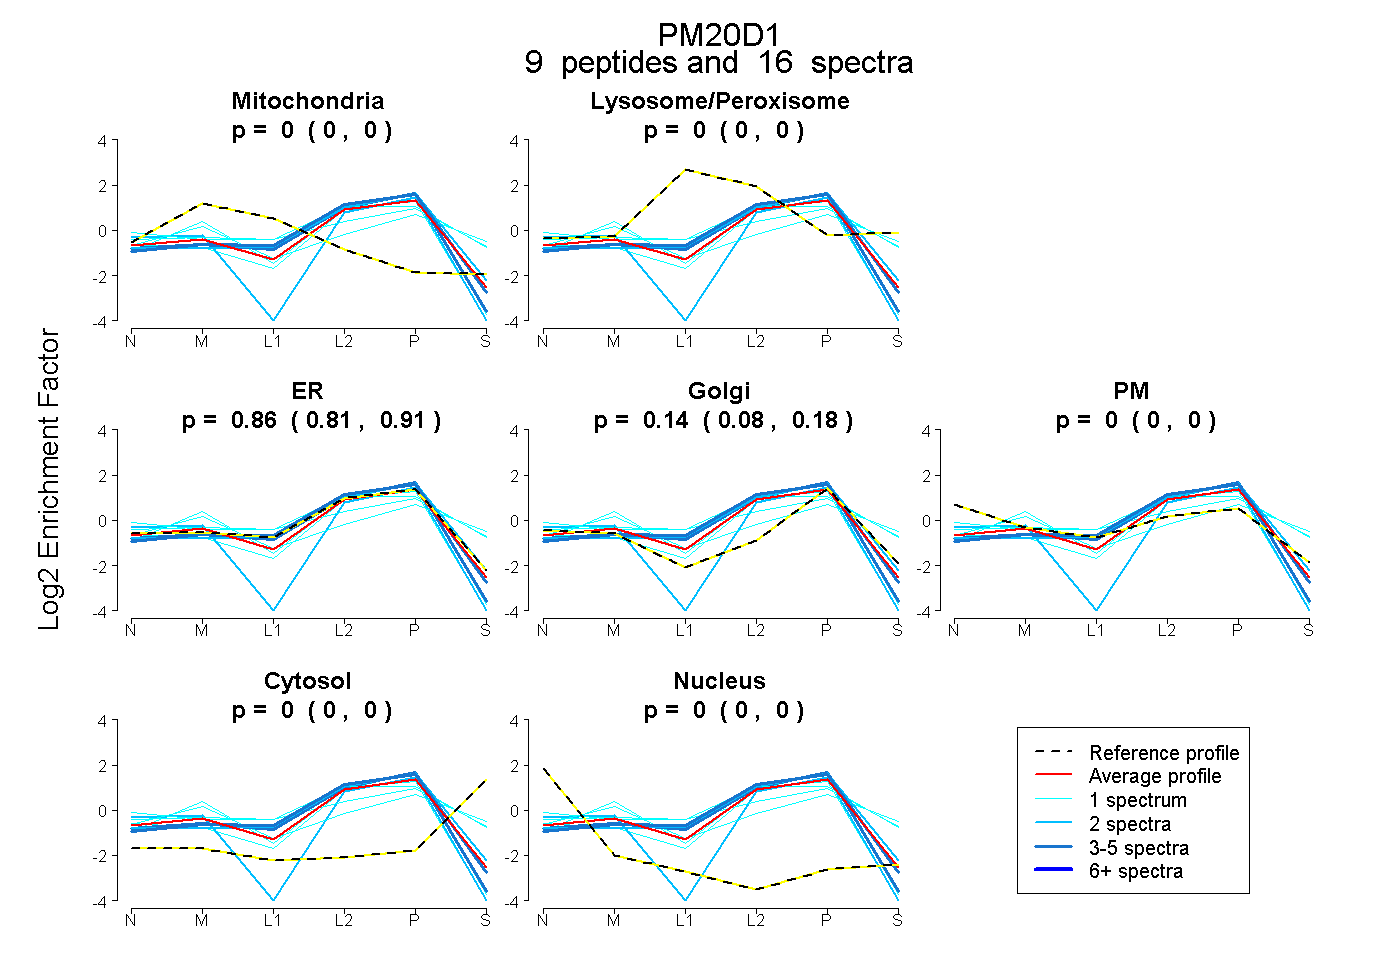 |
0.000 0.000 | 0.000 |
0.000 0.000 | 0.000 |
0.865 0.809 | 0.908 |
0.135 0.082 | 0.181 |
0.000 0.000 | 0.000 |
0.000 0.000 | 0.000 |
0.000 0.000 | 0.000 |
|||
| Plot | Lyso | Other | |||||||||||
| Expt C |
11 peptides |
71 spectra |
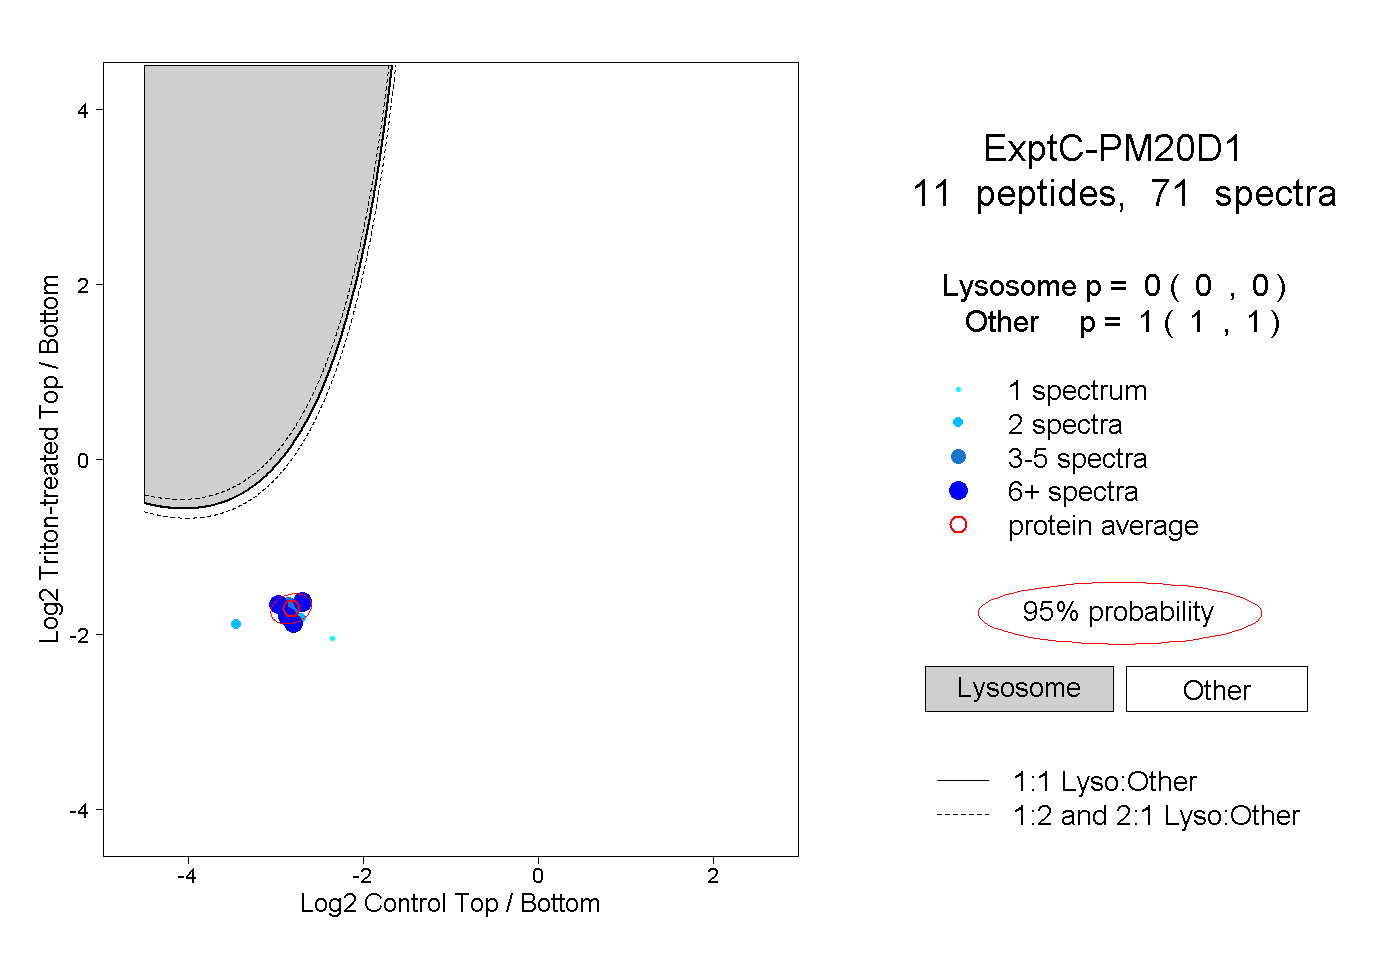 |
0.000 0.000 | 0.000 |
1.000 1.000 | 1.000 |
||||||||
| Plot | Lyso | Other | |||||||||||
| Expt D |
4 peptides |
4 spectra |
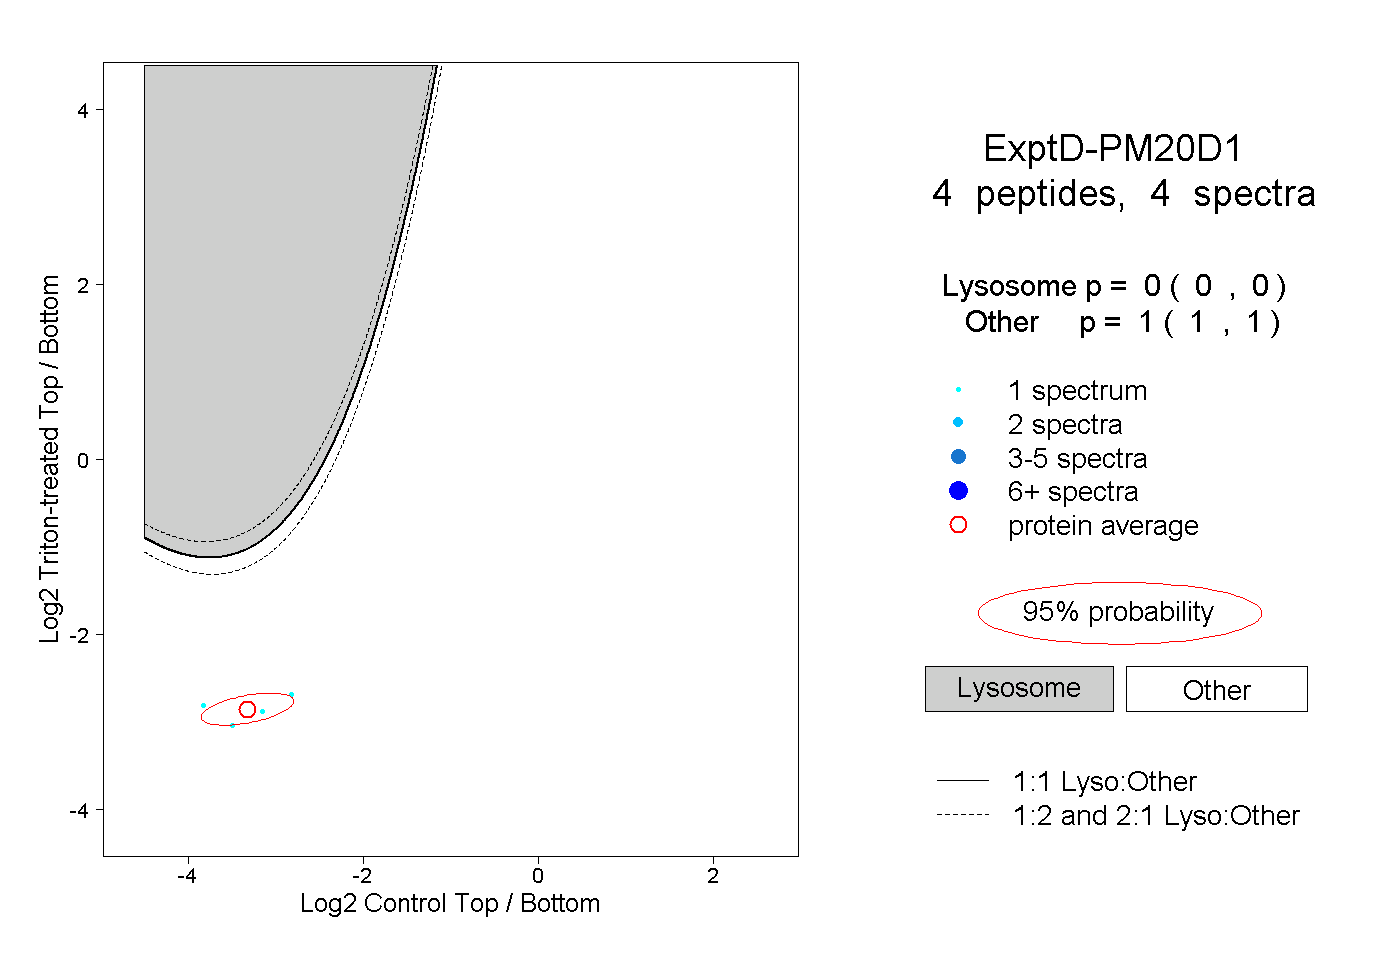 |
0.000 0.000 | 0.000 |
1.000 1.000 | 1.000 |