 6
6peptides
spectra
0.000 | 0.000
0.000 | 0.000
0.000 | 0.082
0.357 | 0.524
0.061 | 0.262
0.159 | 0.334
0.055 | 0.108
0.000 | 0.000
8peptides
spectra
0.000 | 0.000
1.000 | 1.000
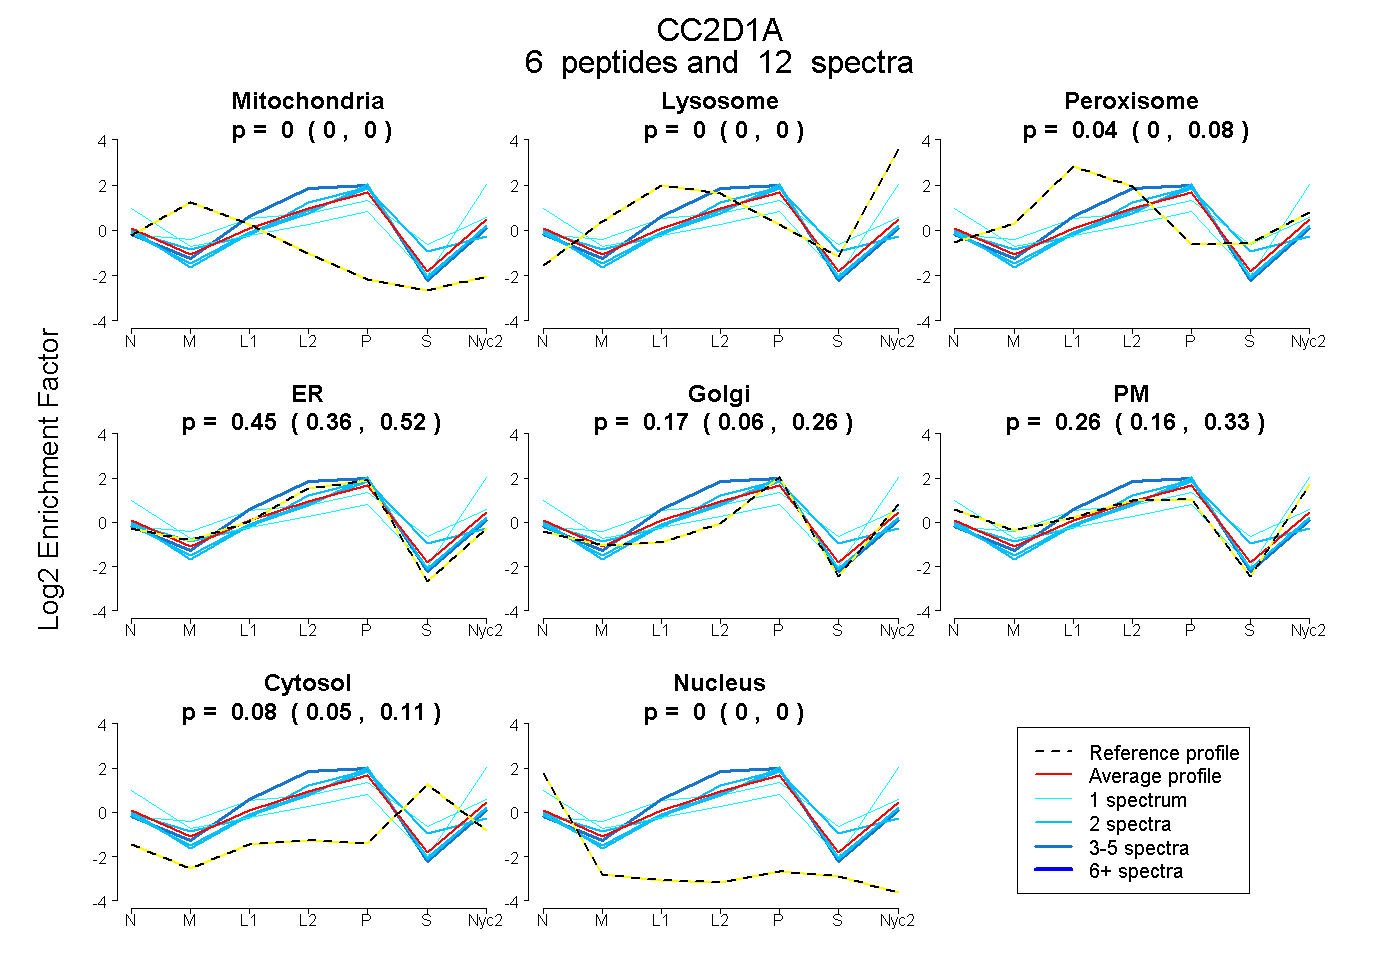
| Plot | Mito | Lyso | Perox | ER | Golgi | PM | Cytosol | Nucleus | |||||
| Expt A |
6 peptides |
12 spectra |
|
0.000 0.000 | 0.000 |
0.000 0.000 | 0.000 |
0.042 0.000 | 0.082 |
0.450 0.357 | 0.524 |
0.168 0.061 | 0.262 |
0.256 0.159 | 0.334 |
0.084 0.055 | 0.108 |
0.000 0.000 | 0.000 |
||
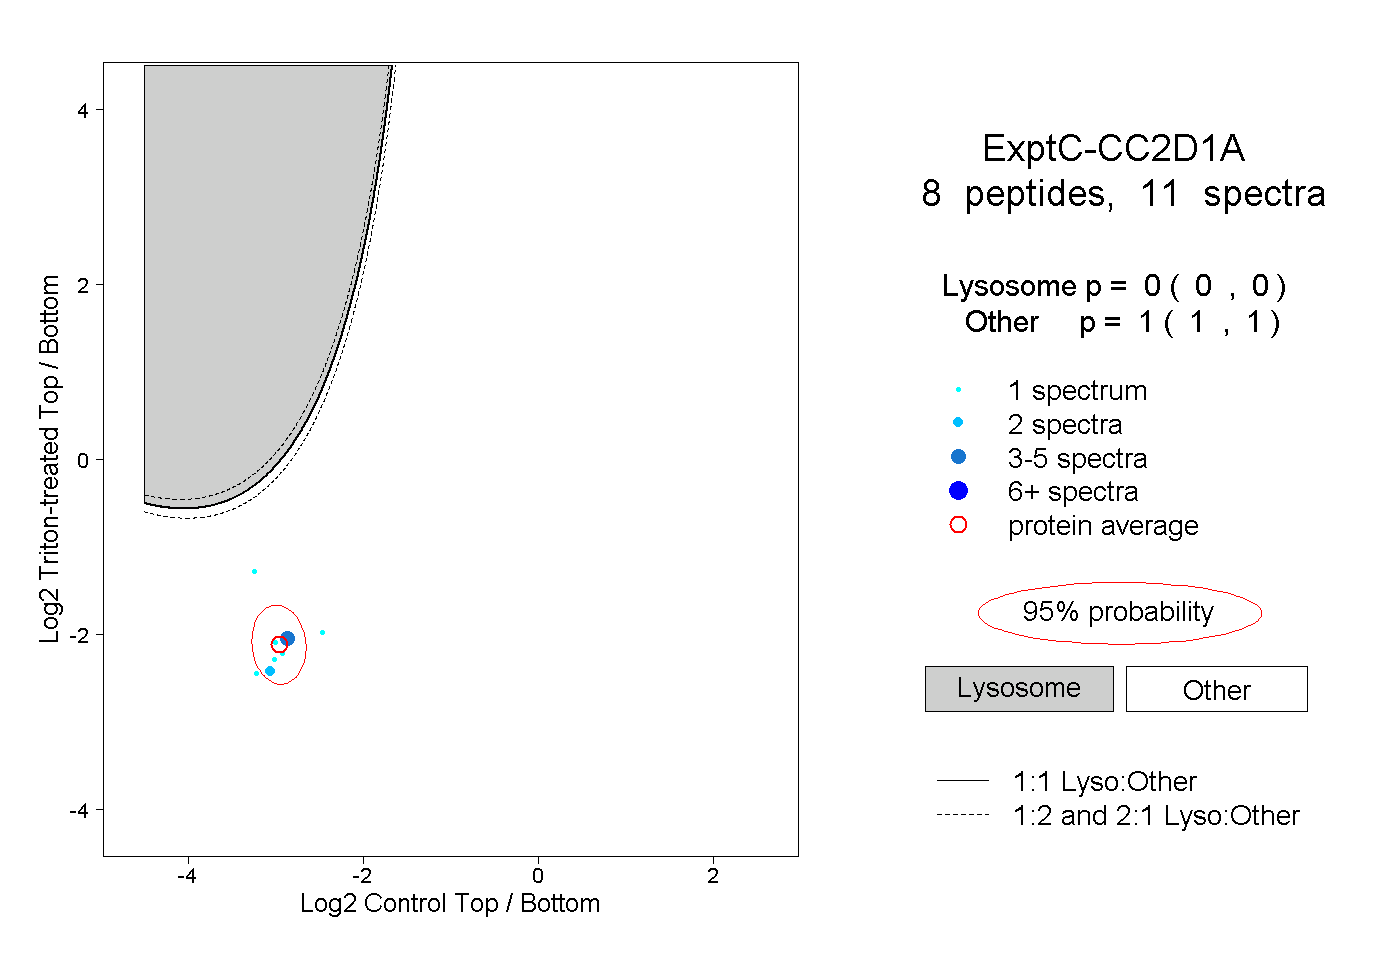
| Plot | Lyso | Other | |||||||||||
| Expt C |
8 peptides |
11 spectra |
|
0.000 0.000 | 0.000 |
1.000 1.000 | 1.000 |