 6
6peptides
spectra
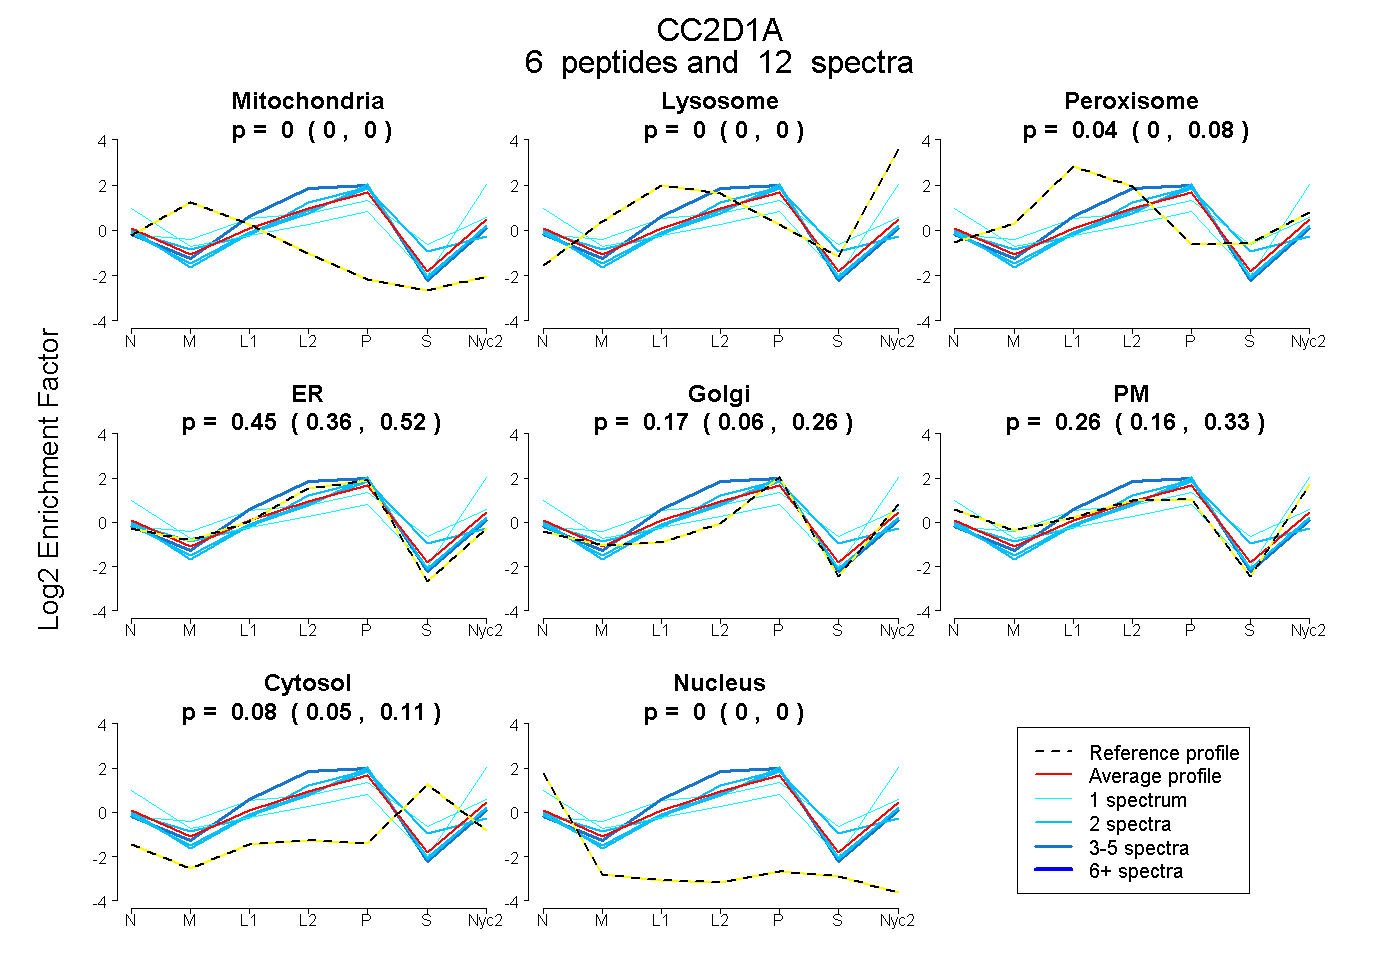
0.000 | 0.000
0.000 | 0.000
0.000 | 0.082
0.357 | 0.524
0.061 | 0.262
0.159 | 0.334
0.055 | 0.108
0.000 | 0.000
| Plot | Mito | Lyso | Perox | ER | Golgi | PM | Cytosol | Nucleus | |||||
| Expt A |
6 peptides |
12 spectra |
|
0.000 0.000 | 0.000 |
0.000 0.000 | 0.000 |
0.042 0.000 | 0.082 |
0.450 0.357 | 0.524 |
0.168 0.061 | 0.262 |
0.256 0.159 | 0.334 |
0.084 0.055 | 0.108 |
0.000 0.000 | 0.000 |
| 1 spectrum, RPVPPEVAQQYQDVVQR | 0.000 | 0.000 | 0.000 | 0.000 | 0.000 | 0.909 | 0.063 | 0.029 | ||
| 2 spectra, NLVESELQR | 0.000 | 0.000 | 0.000 | 0.530 | 0.384 | 0.026 | 0.060 | 0.000 | ||
| 4 spectra, GAVTAR | 0.000 | 0.032 | 0.075 | 0.893 | 0.000 | 0.000 | 0.000 | 0.000 | ||
| 2 spectra, QLLQAALR | 0.000 | 0.000 | 0.000 | 0.656 | 0.157 | 0.139 | 0.048 | 0.000 | ||
| 2 spectra, GLEPMLEASR | 0.000 | 0.000 | 0.018 | 0.678 | 0.073 | 0.000 | 0.231 | 0.000 | ||
| 1 spectrum, FDFPYPNVEEAQK | 0.000 | 0.000 | 0.398 | 0.028 | 0.493 | 0.000 | 0.081 | 0.000 |
| Plot | Lyso | Other | |||||||||||
| Expt C |
8 peptides |
11 spectra |
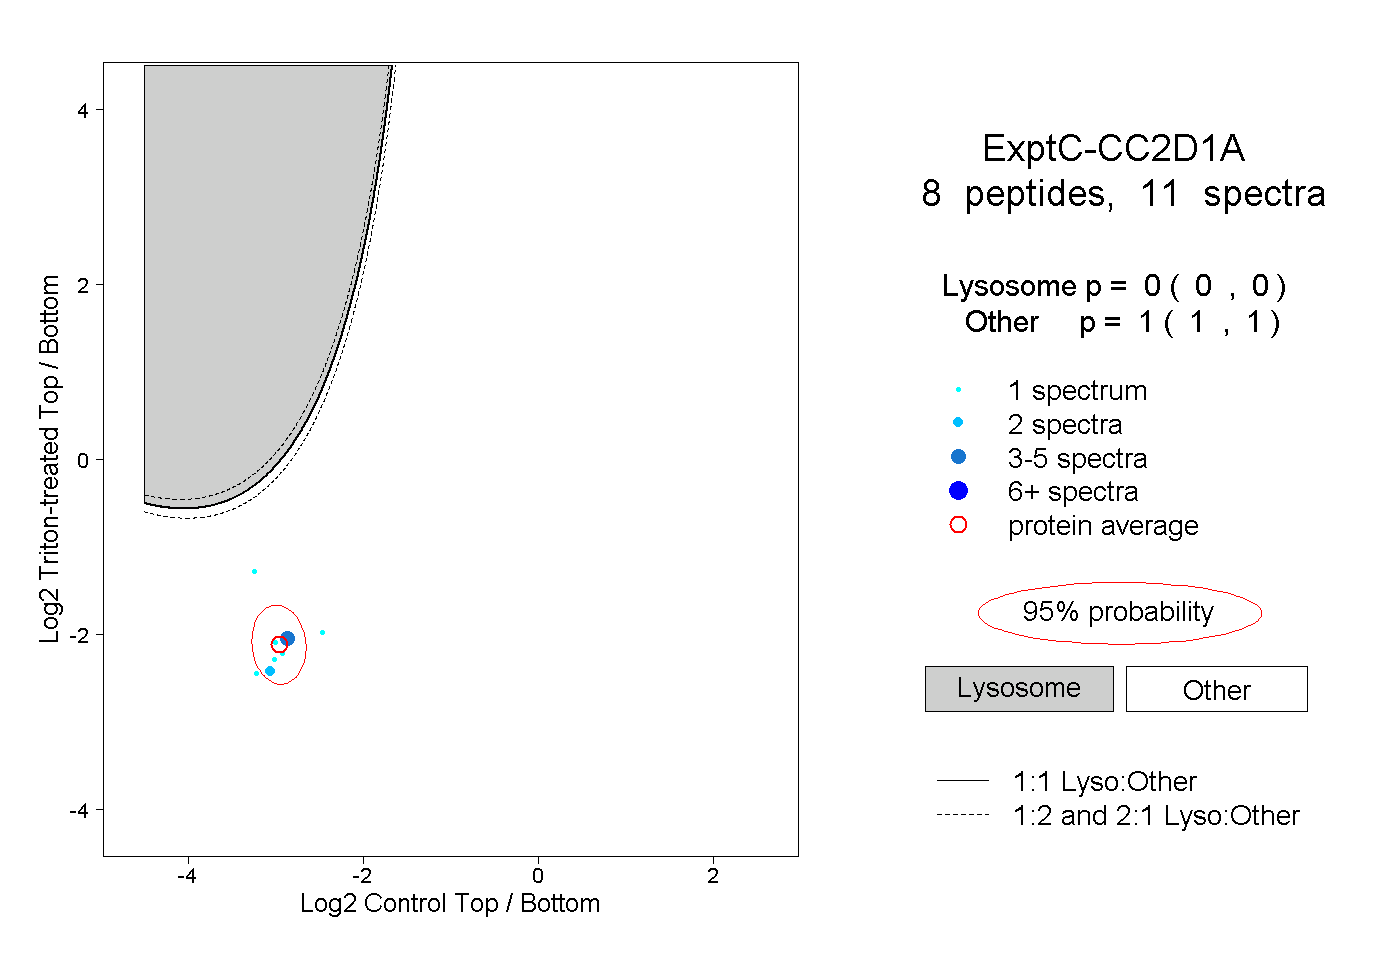 |
0.000 0.000 | 0.000 |
1.000 1.000 | 1.000 |