 4
4peptides
spectra
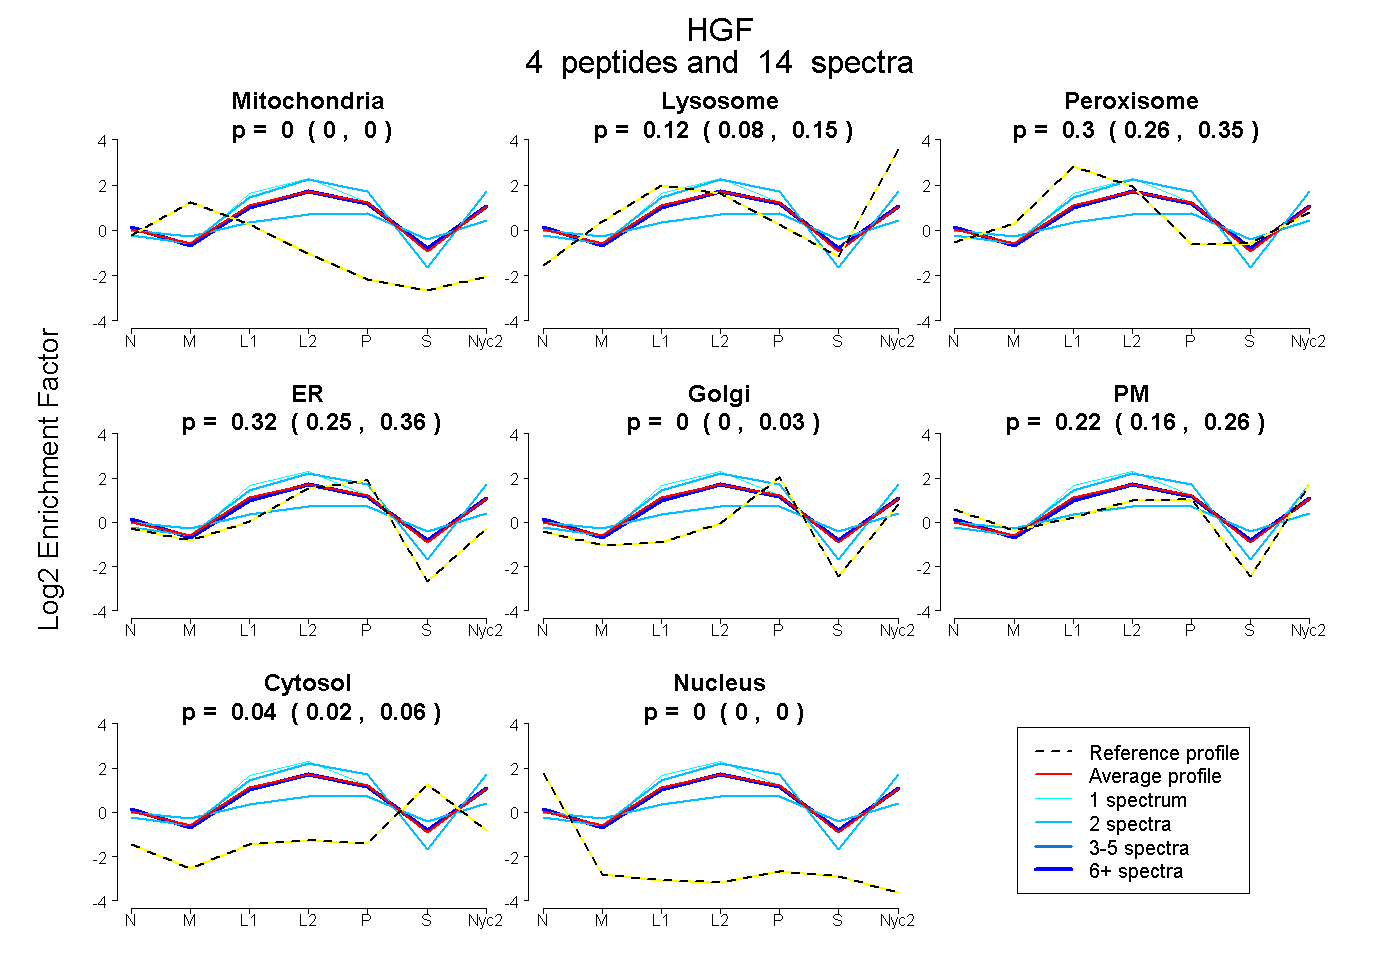
0.000 | 0.000
0.077 | 0.146
0.260 | 0.346
0.250 | 0.364
0.000 | 0.034
0.164 | 0.260
0.016 | 0.059
0.000 | 0.000
7peptides
spectra
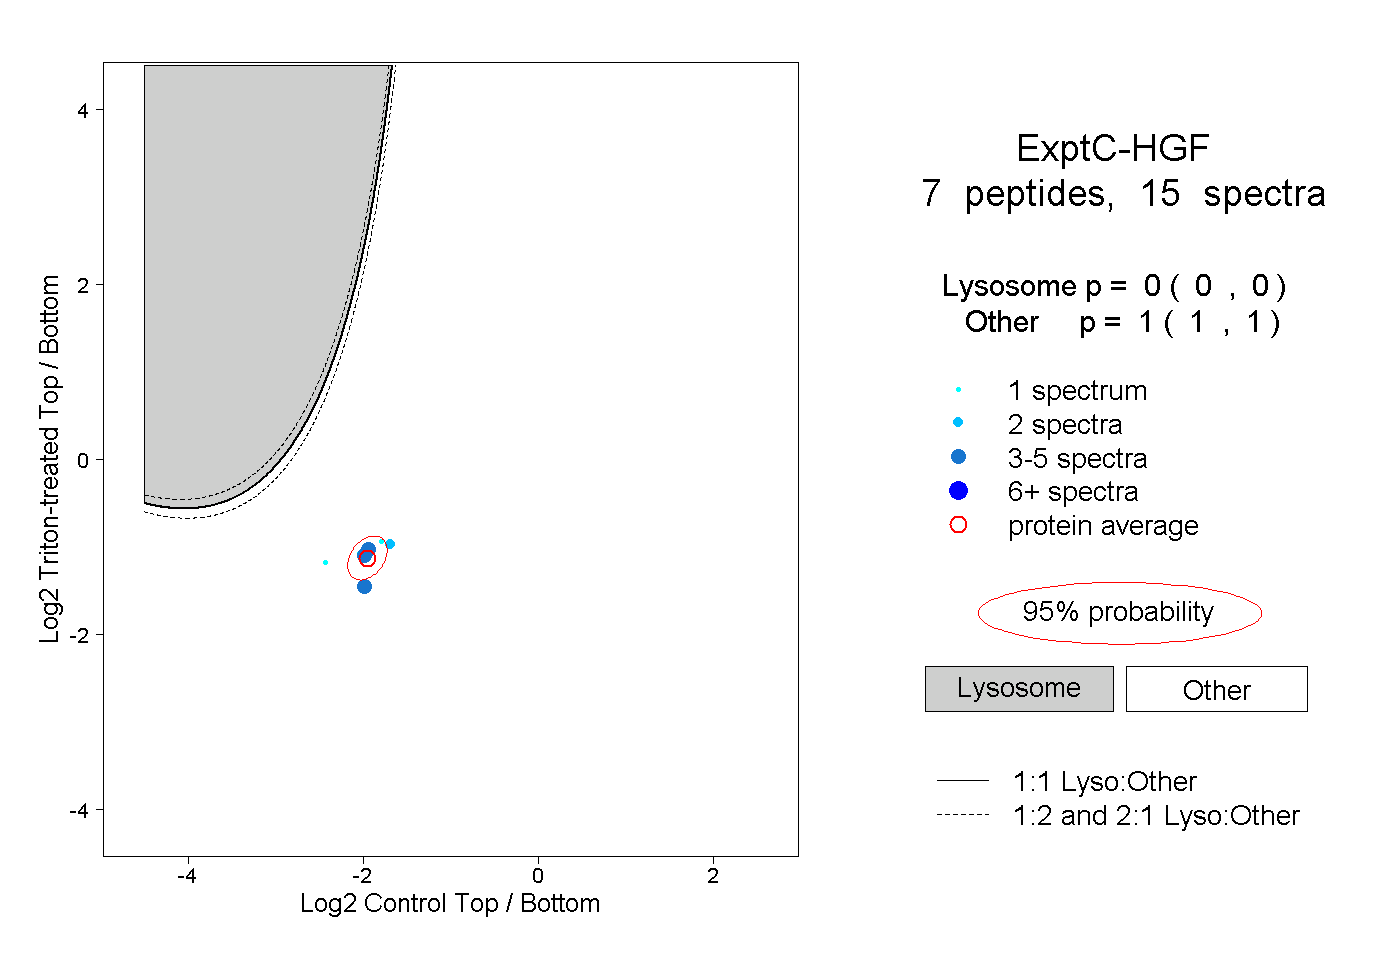
0.000 | 0.000
1.000 | 1.000
1peptide
spectrum
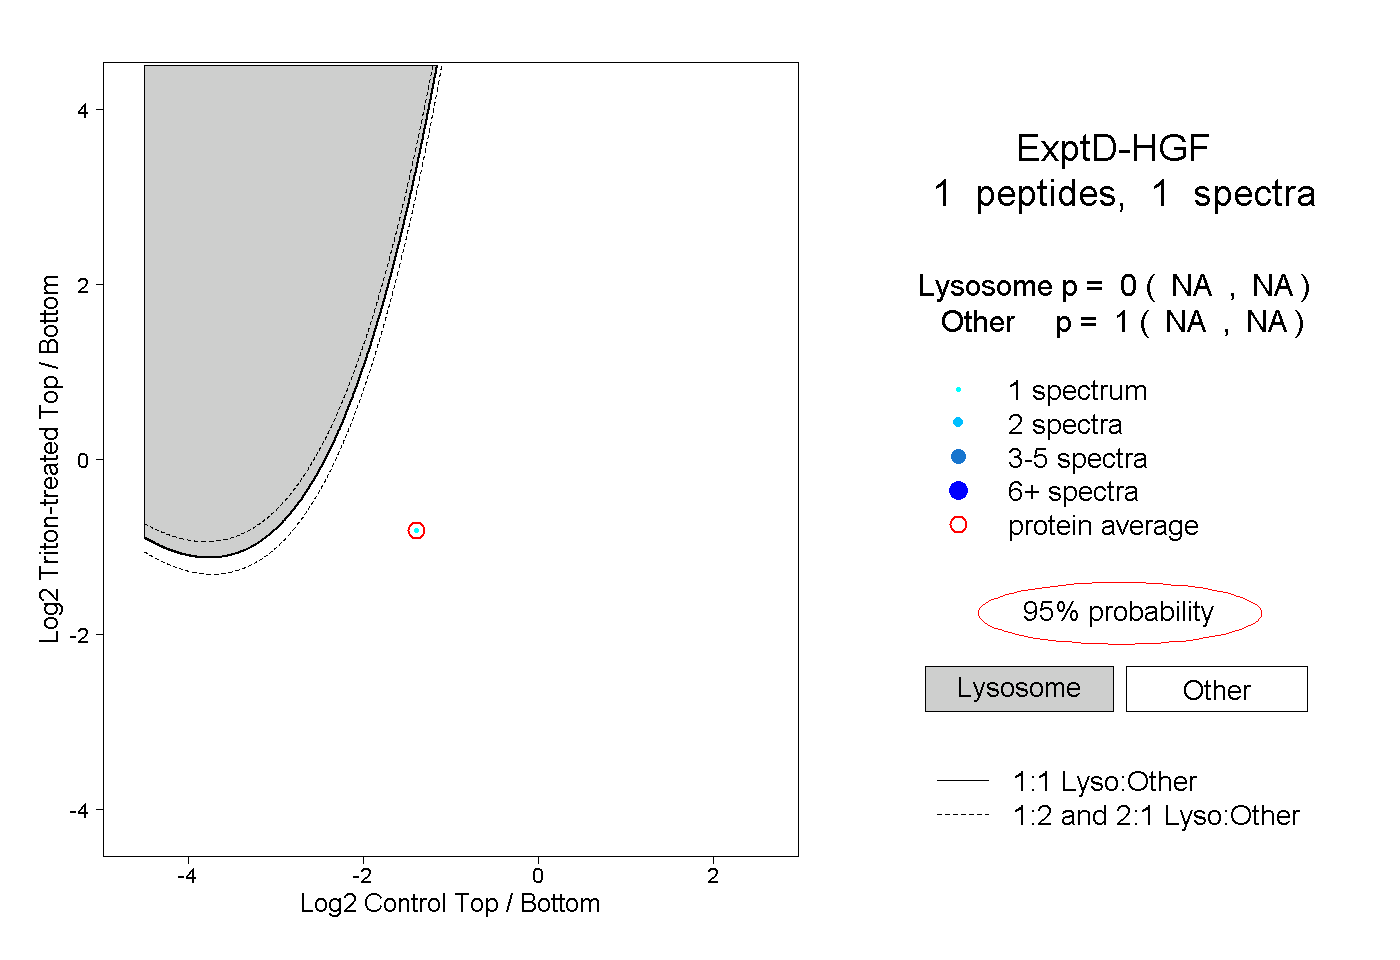
NA | NA
NA | NA