 4
4peptides
spectra
0.000 | 0.000
0.077 | 0.146
0.260 | 0.346
0.250 | 0.364
0.000 | 0.034
0.164 | 0.260
0.016 | 0.059
0.000 | 0.000
| Plot | Mito | Lyso | Perox | ER | Golgi | PM | Cytosol | Nucleus | |||||
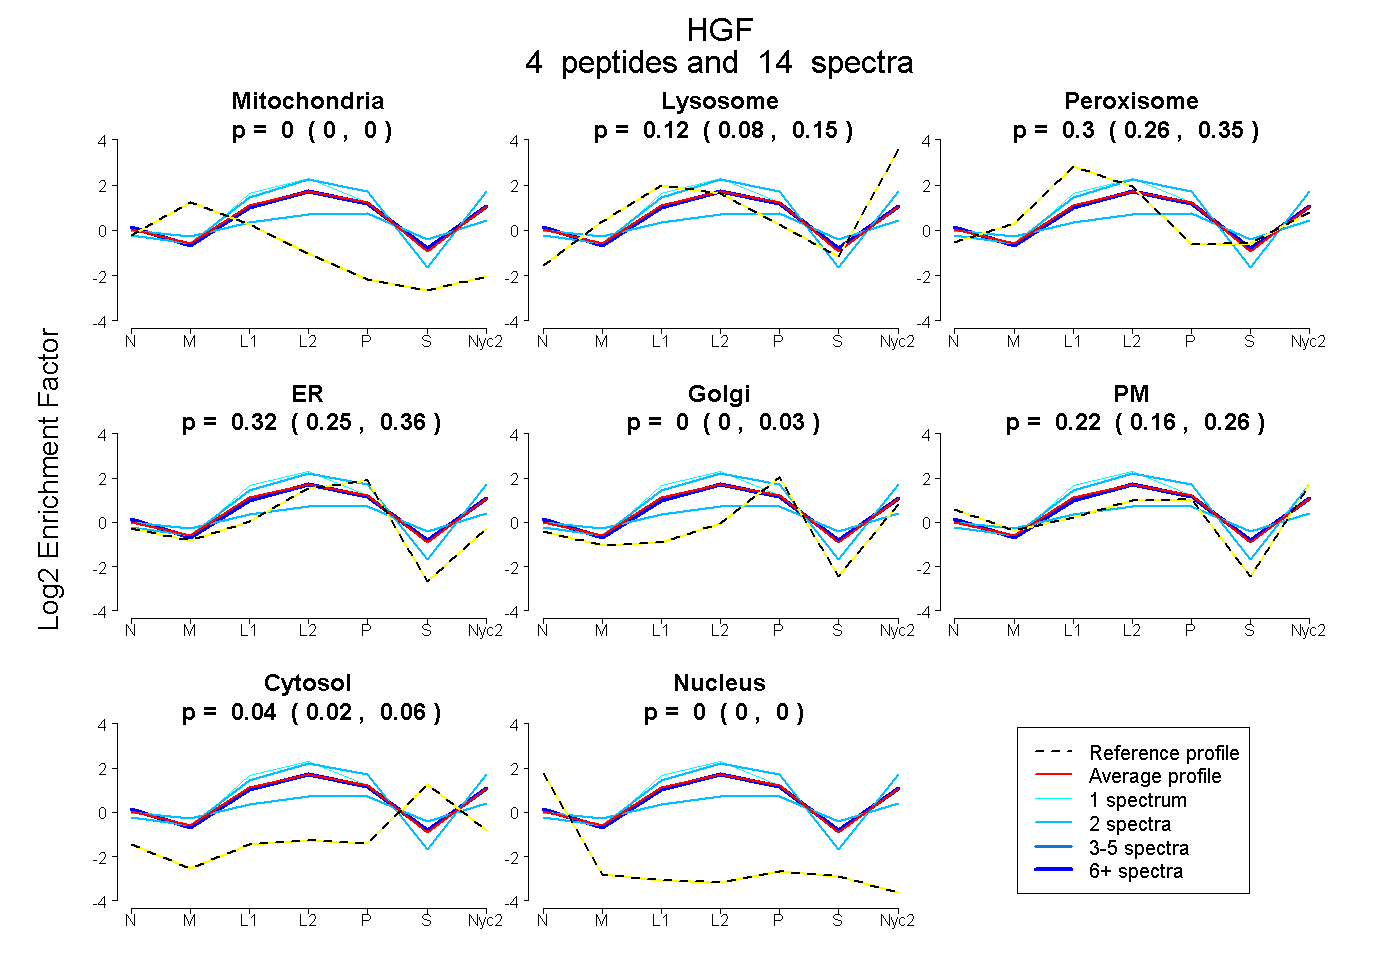
| Expt A |
4 peptides |
14 spectra |
|
0.000 0.000 | 0.000 |
0.116 0.077 | 0.146 |
0.301 0.260 | 0.346 |
0.321 0.250 | 0.364 |
0.000 0.000 | 0.034 |
0.221 0.164 | 0.260 |
0.042 0.016 | 0.059 |
0.000 0.000 | 0.000 |
| 2 spectra, NMEDLHR | 0.000 | 0.000 | 0.337 | 0.078 | 0.195 | 0.190 | 0.200 | 0.000 | ||
| 1 spectrum, CDVSSGQDCYR | 0.000 | 0.081 | 0.445 | 0.340 | 0.000 | 0.134 | 0.000 | 0.000 | ||
| 9 spectra, GCAIPNRPGIFVR | 0.000 | 0.090 | 0.299 | 0.281 | 0.000 | 0.269 | 0.061 | 0.000 | ||
| 2 spectra, MVLGVIVPGR | 0.000 | 0.413 | 0.062 | 0.486 | 0.000 | 0.040 | 0.000 | 0.000 |
| Plot | Lyso | Other | |||||||||||
| Expt C |
7 peptides |
15 spectra |
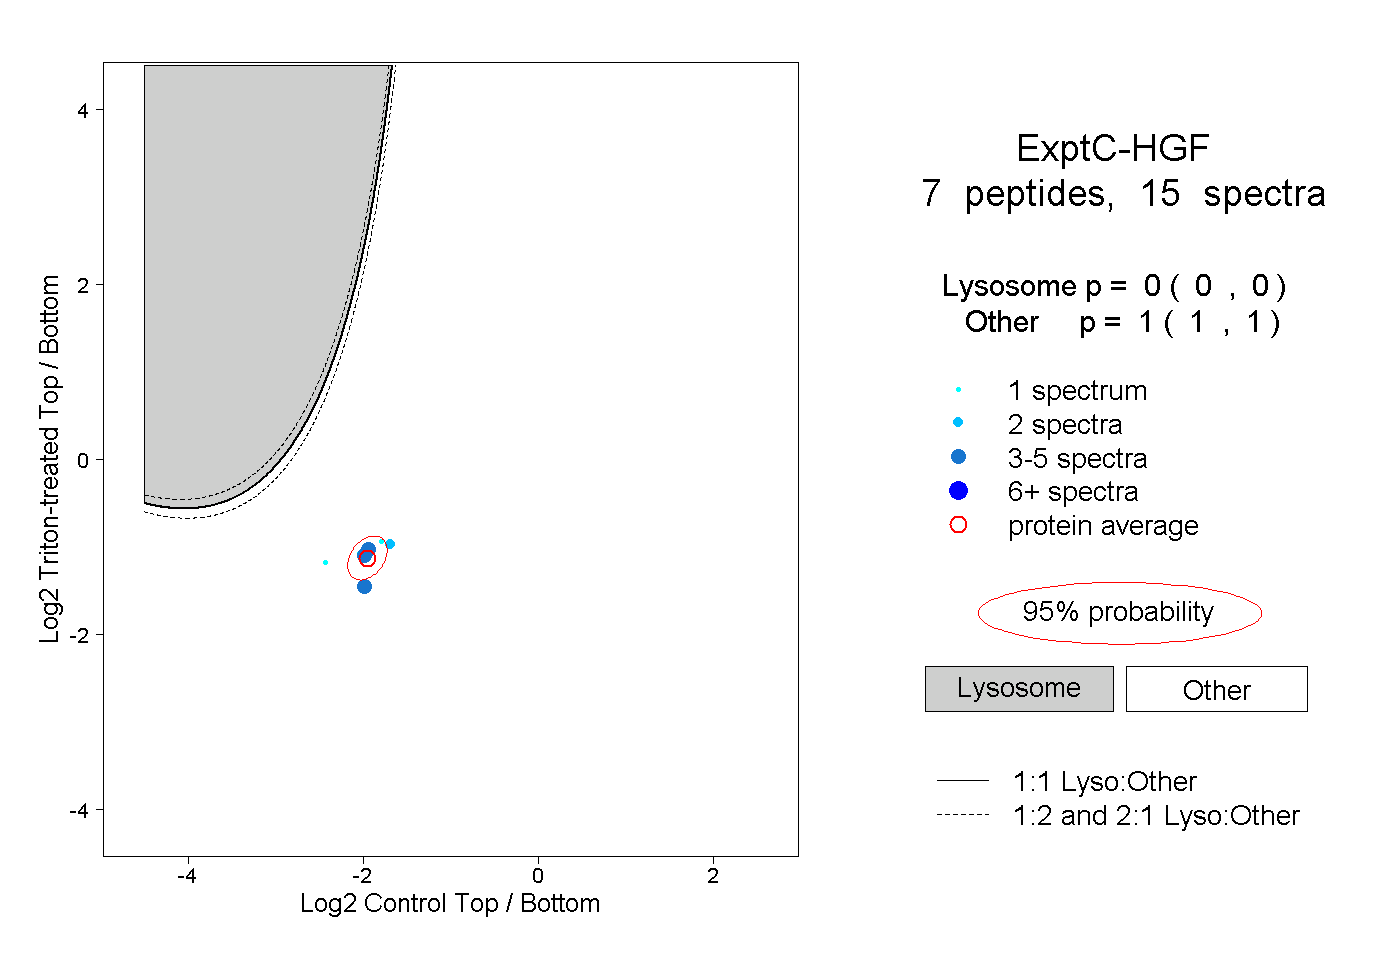 |
0.000 0.000 | 0.000 |
1.000 1.000 | 1.000 |
||||||||
| Plot | Lyso | Other | |||||||||||
| Expt D |
1 peptide |
1 spectrum |
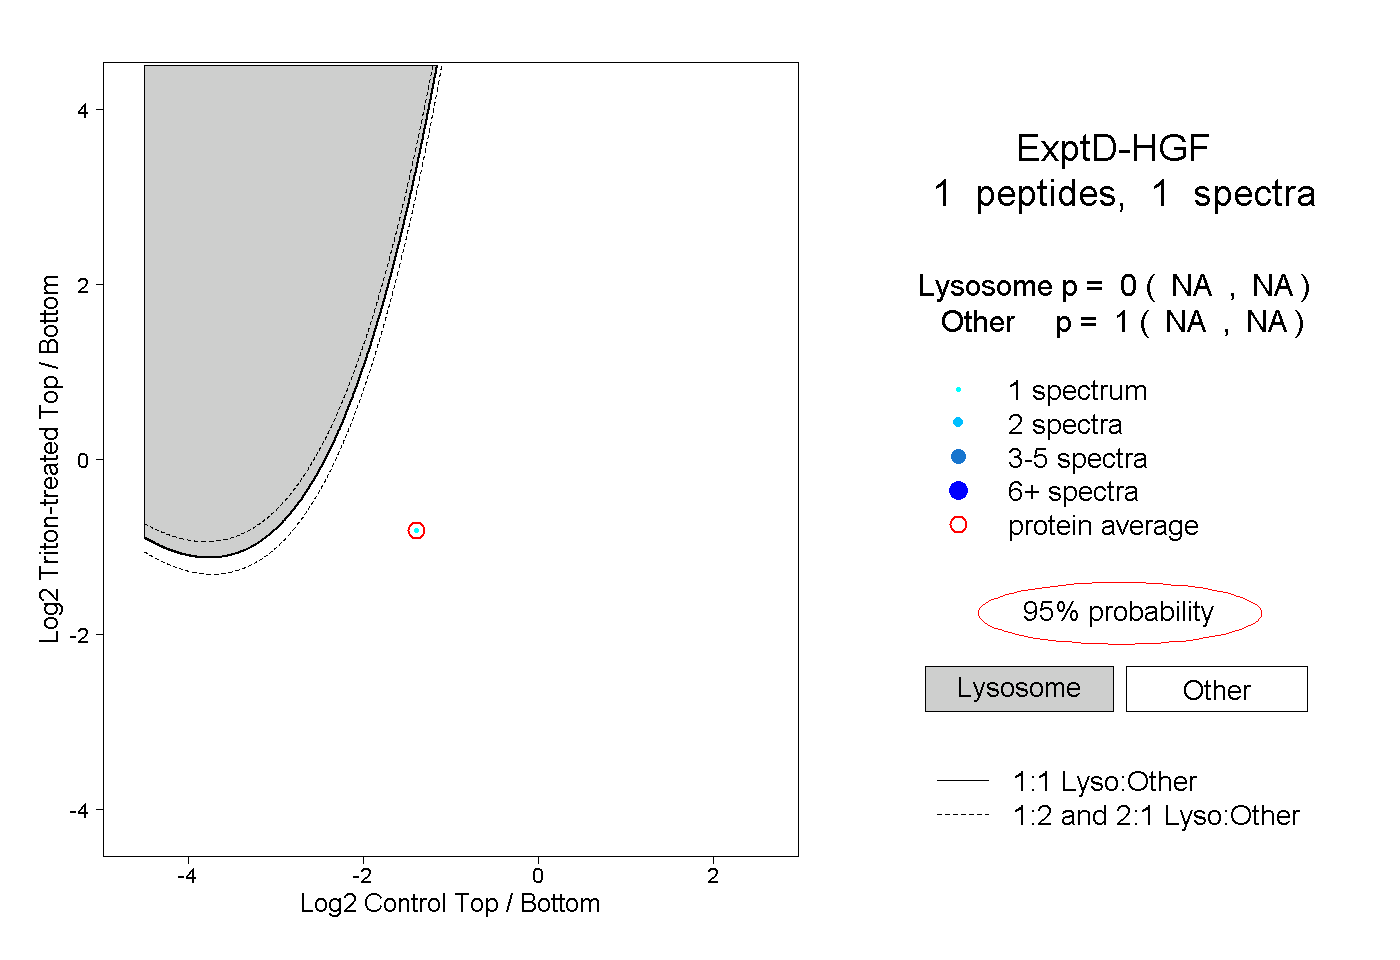 |
0.000 NA | NA |
1.000 NA | NA |