 6
6peptides
spectra
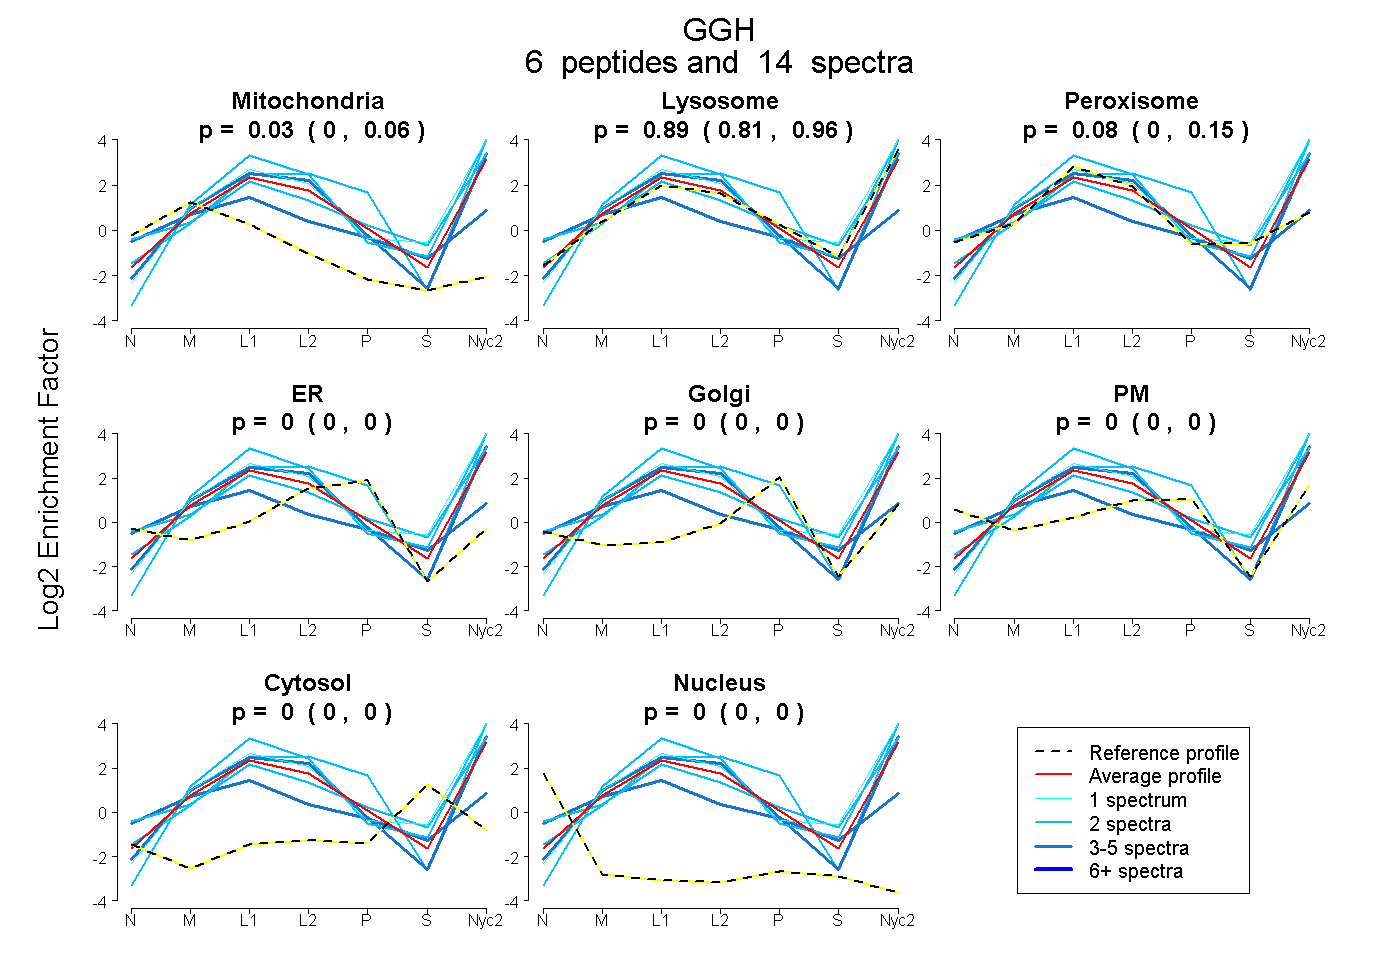
0.000 | 0.058
0.813 | 0.960
0.000 | 0.150
0.000 | 0.000
0.000 | 0.000
0.000 | 0.000
0.000 | 0.000
0.000 | 0.000
4peptides
spectra
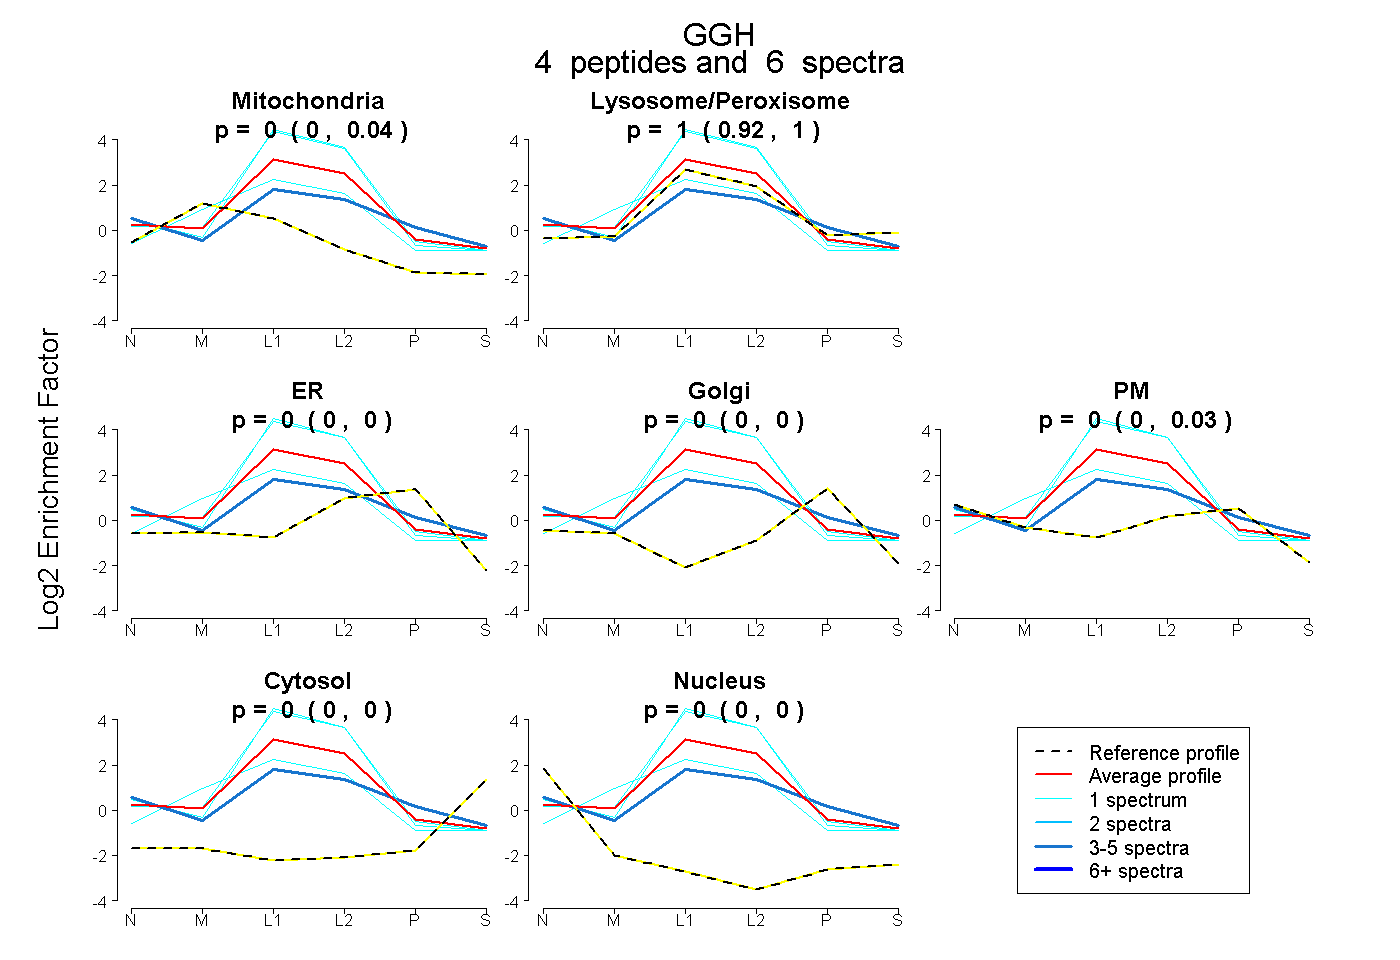
0.000 | 0.045
0.922 | 1.000
0.000 | 0.000
0.000 | 0.000
0.000 | 0.033
0.000 | 0.000
0.000 | 0.000
11peptides
spectra
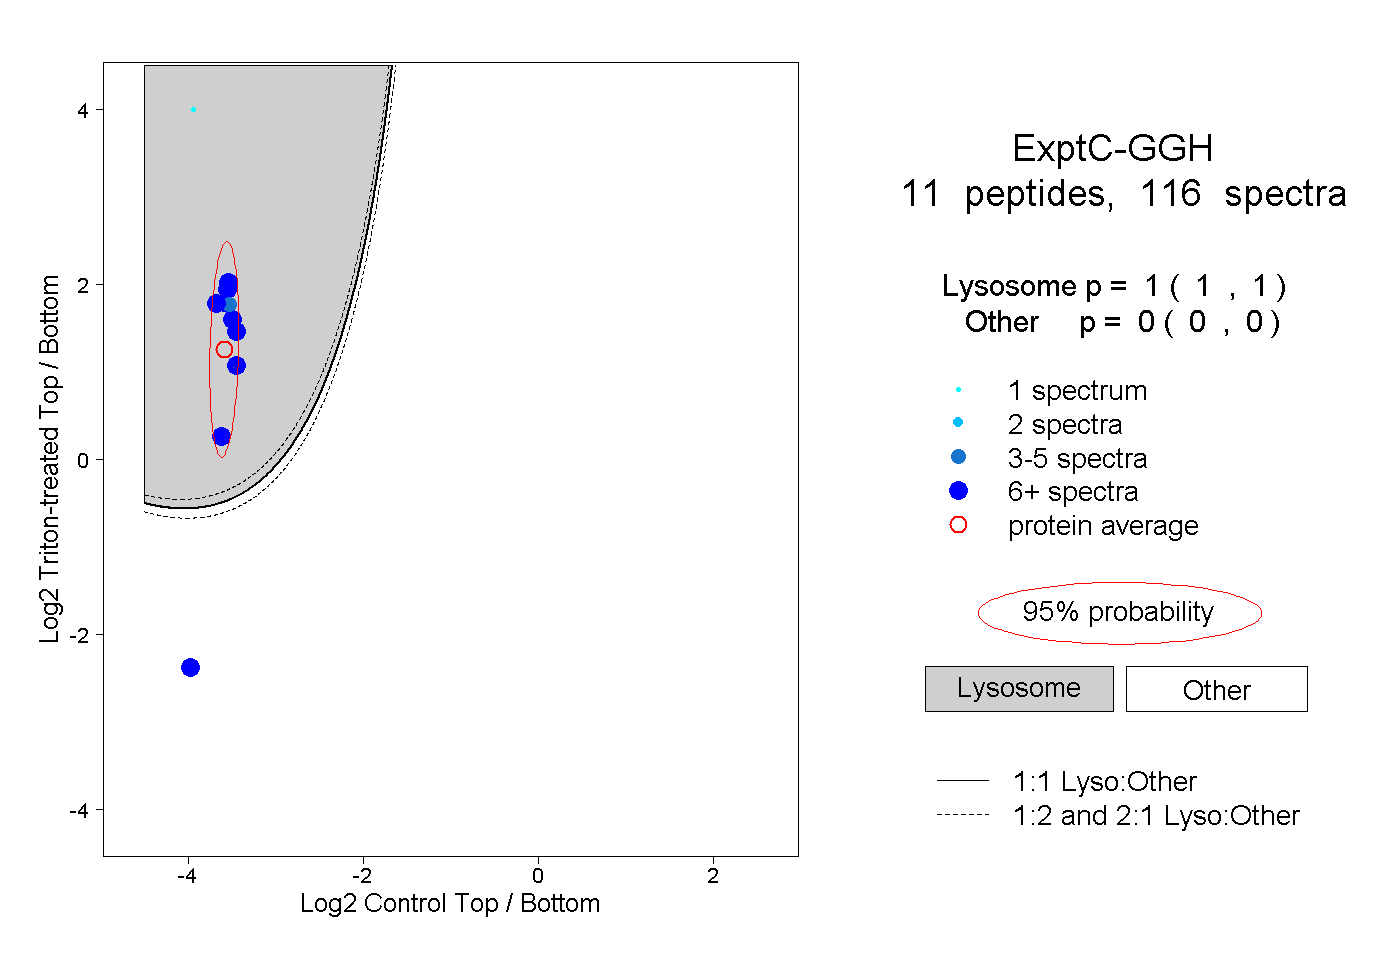
1.000 | 1.000
0.000 | 0.000
1peptide
spectra
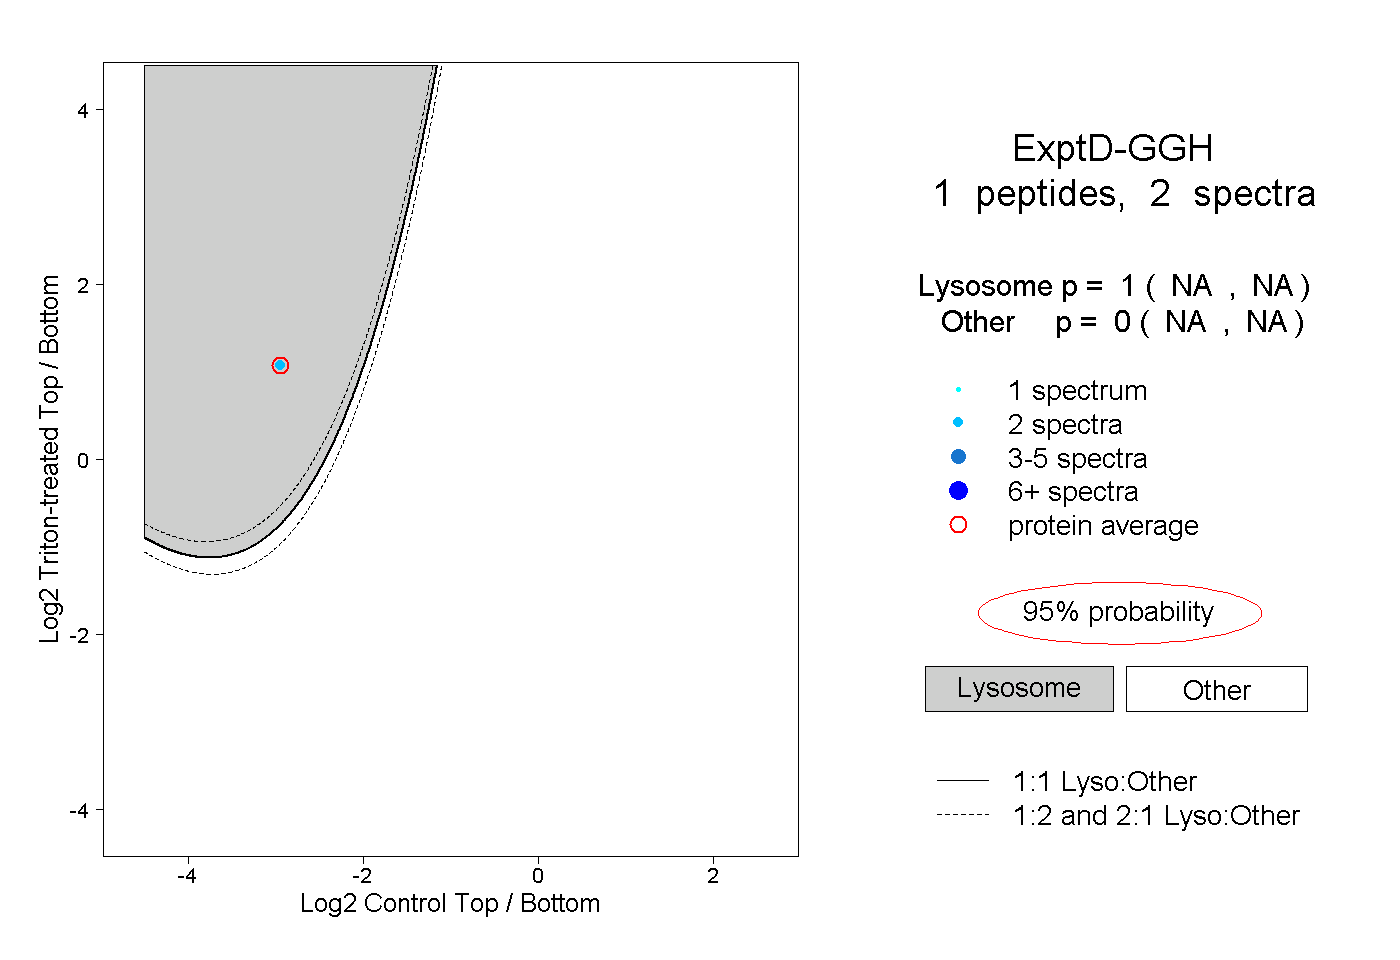
NA | NA
NA | NA