 6
6peptides
spectra
0.000 | 0.058
0.813 | 0.960
0.000 | 0.150
0.000 | 0.000
0.000 | 0.000
0.000 | 0.000
0.000 | 0.000
0.000 | 0.000
| Plot | Mito | Lyso | Perox | ER | Golgi | PM | Cytosol | Nucleus | |||||
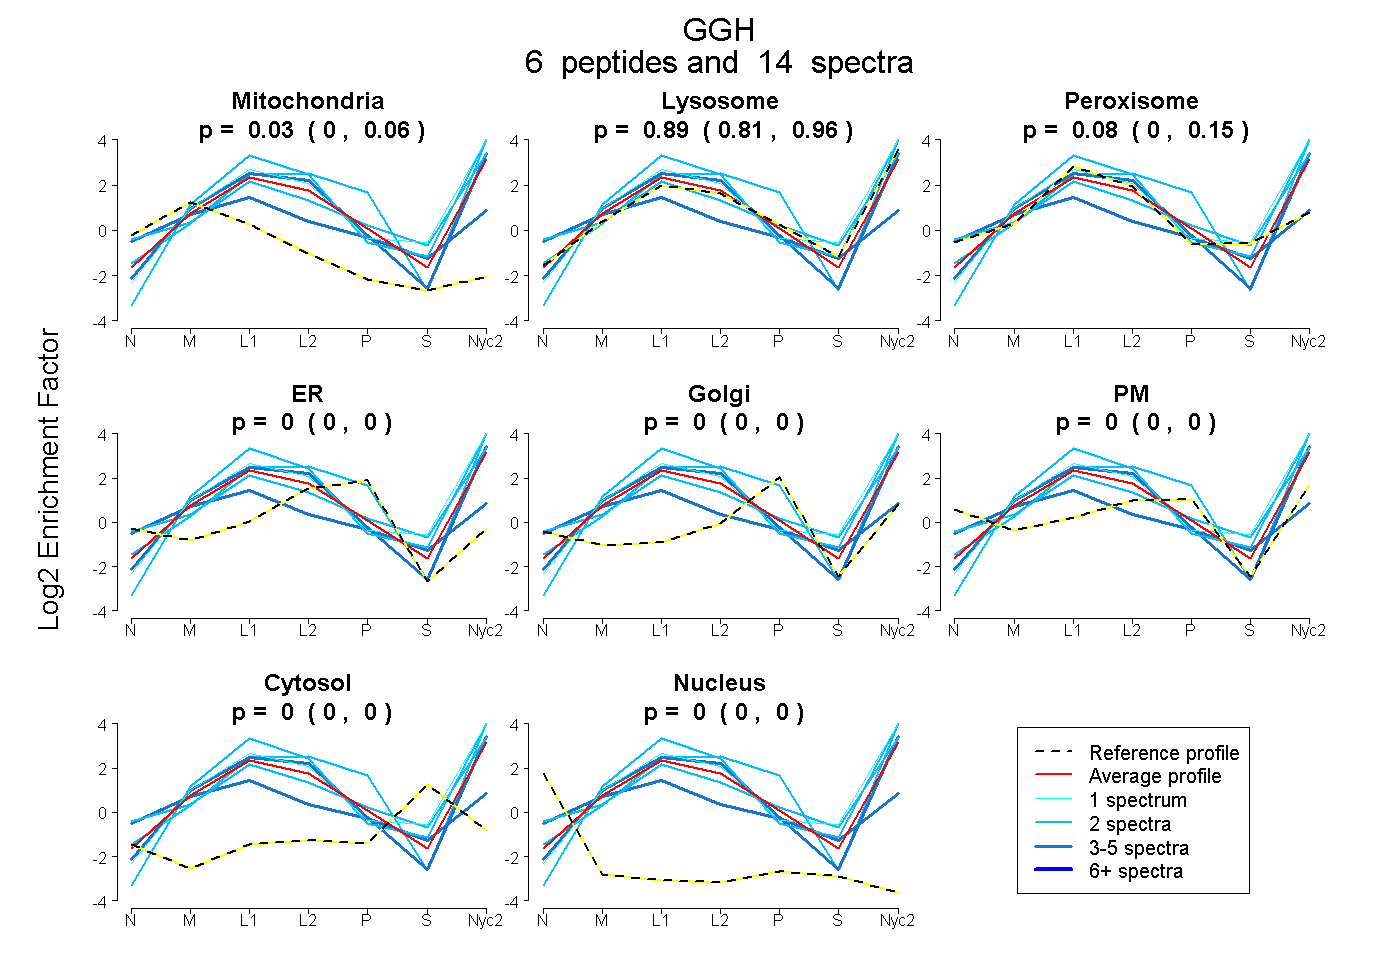
| Expt A |
6 peptides |
14 spectra |
|
0.029 0.000 | 0.058 |
0.894 0.813 | 0.960 |
0.077 0.000 | 0.150 |
0.000 0.000 | 0.000 |
0.000 0.000 | 0.000 |
0.000 0.000 | 0.000 |
0.000 0.000 | 0.000 |
0.000 0.000 | 0.000 |
| 2 spectra, FIESAGAR | 0.000 | 0.758 | 0.151 | 0.000 | 0.000 | 0.091 | 0.000 | 0.000 | ||
| 4 spectra, FFNILTVNTDGK | 0.030 | 0.970 | 0.000 | 0.000 | 0.000 | 0.000 | 0.000 | 0.000 | ||
| 2 spectra, APFEWK | 0.000 | 0.920 | 0.000 | 0.080 | 0.000 | 0.000 | 0.000 | 0.000 | ||
| 1 spectrum, TSFYLAK | 0.000 | 1.000 | 0.000 | 0.000 | 0.000 | 0.000 | 0.000 | 0.000 | ||
| 2 spectra, LDLNDAQYETLFR | 0.000 | 1.000 | 0.000 | 0.000 | 0.000 | 0.000 | 0.000 | 0.000 | ||
| 3 spectra, ASLGR | 0.293 | 0.300 | 0.277 | 0.000 | 0.103 | 0.017 | 0.009 | 0.000 |
| Plot | Mito | Lyso or Perox | ER | Golgi | PM | Cytosol | Nucleus | ||||||
| Expt B |
4 peptides |
6 spectra |
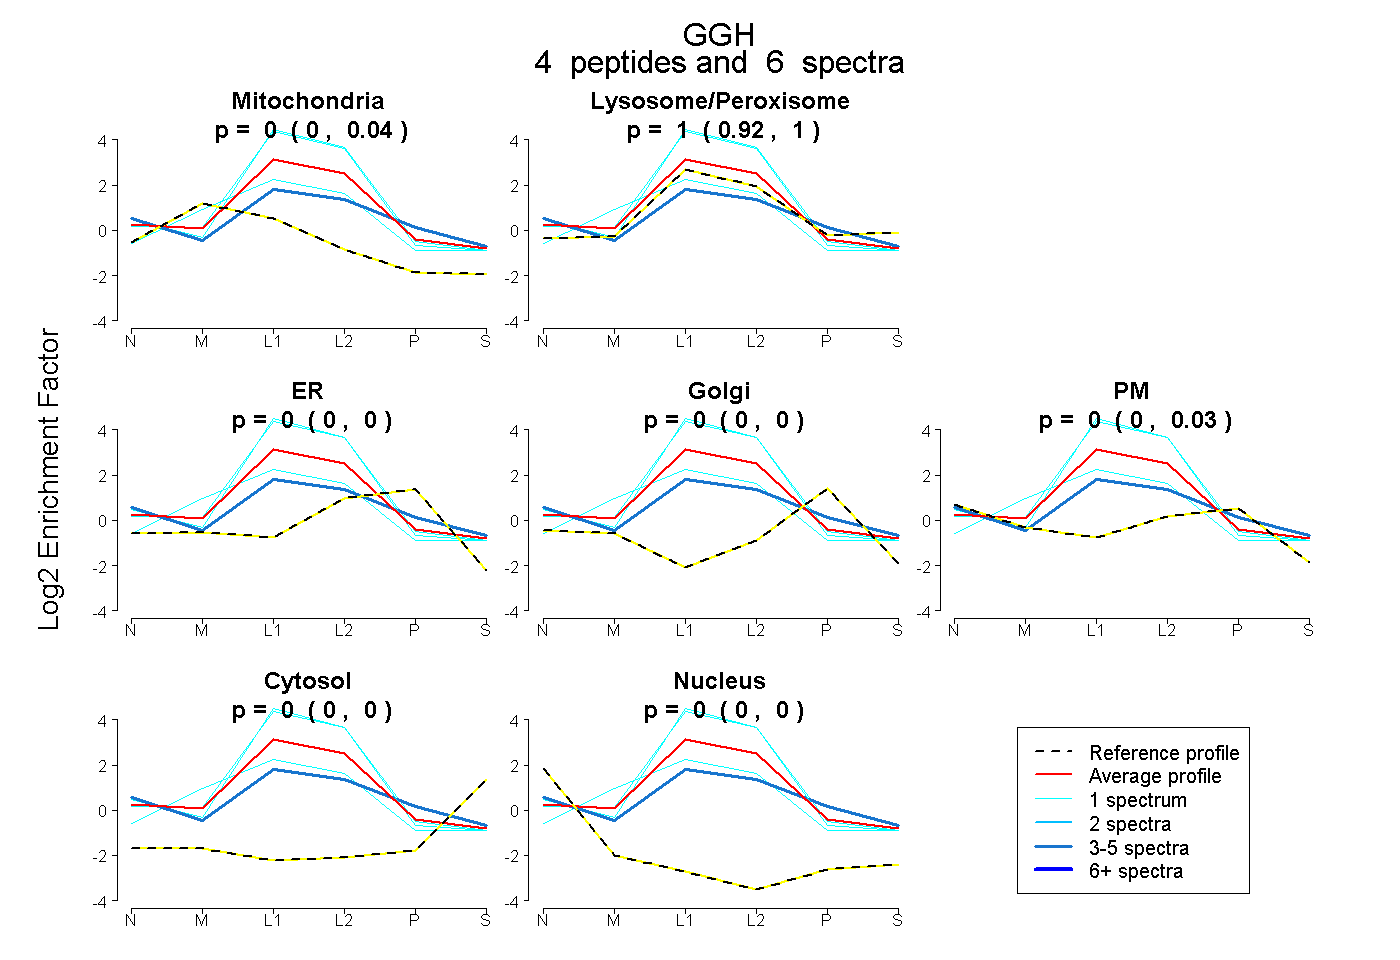 |
0.000 0.000 | 0.045 |
1.000 0.922 | 1.000 |
0.000 0.000 | 0.000 |
0.000 0.000 | 0.000 |
0.000 0.000 | 0.033 |
0.000 0.000 | 0.000 |
0.000 0.000 | 0.000 |
|||
| Plot | Lyso | Other | |||||||||||
| Expt C |
11 peptides |
116 spectra |
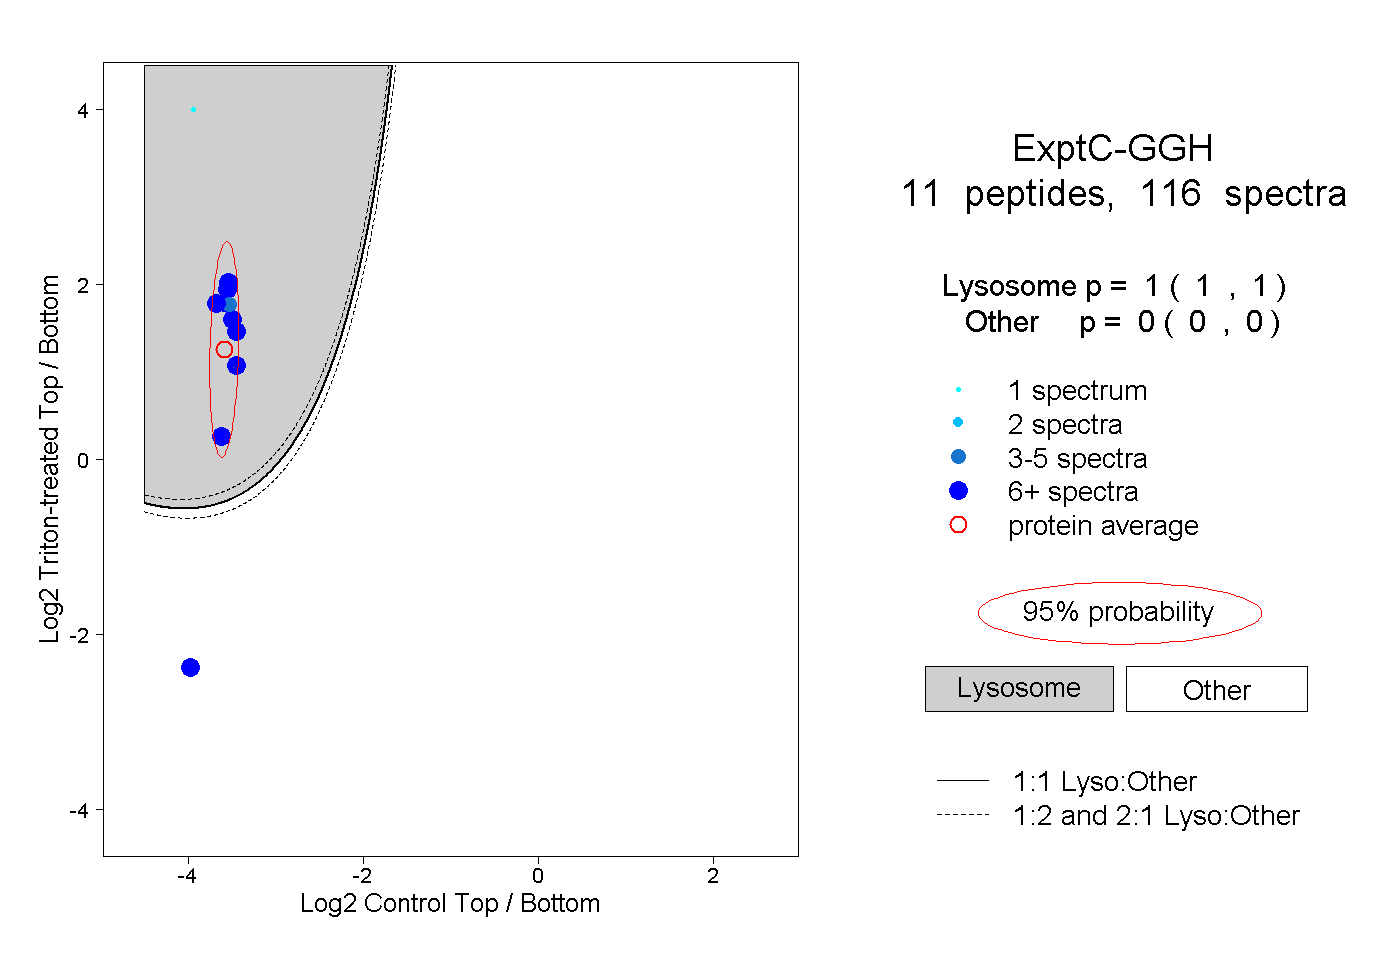 |
1.000 1.000 | 1.000 |
0.000 0.000 | 0.000 |
||||||||
| Plot | Lyso | Other | |||||||||||
| Expt D |
1 peptide |
2 spectra |
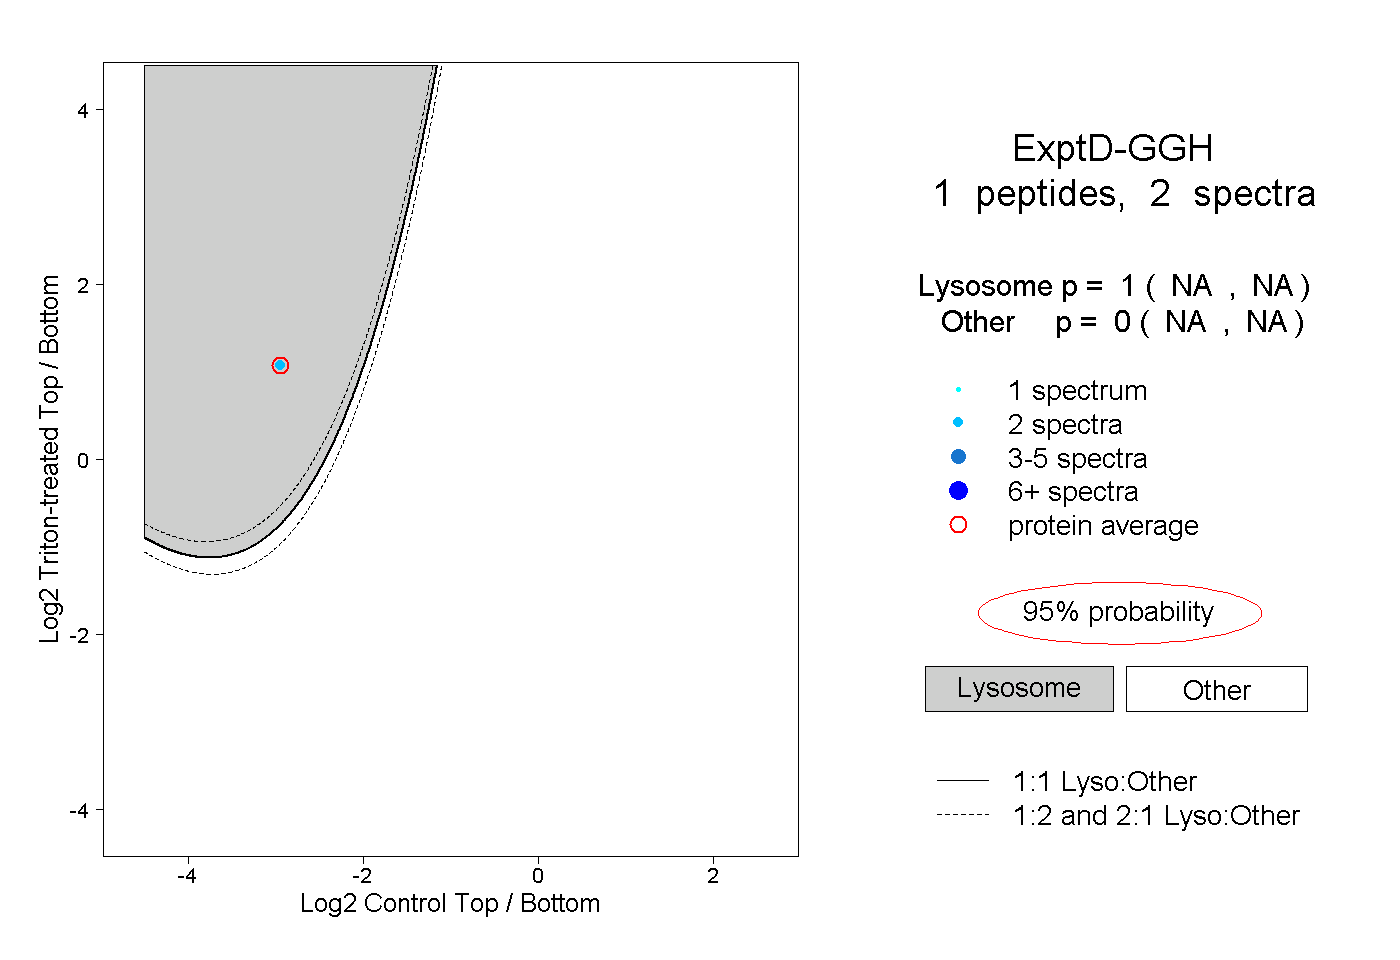 |
1.000 NA | NA |
0.000 NA | NA |