 12
12peptides
spectra
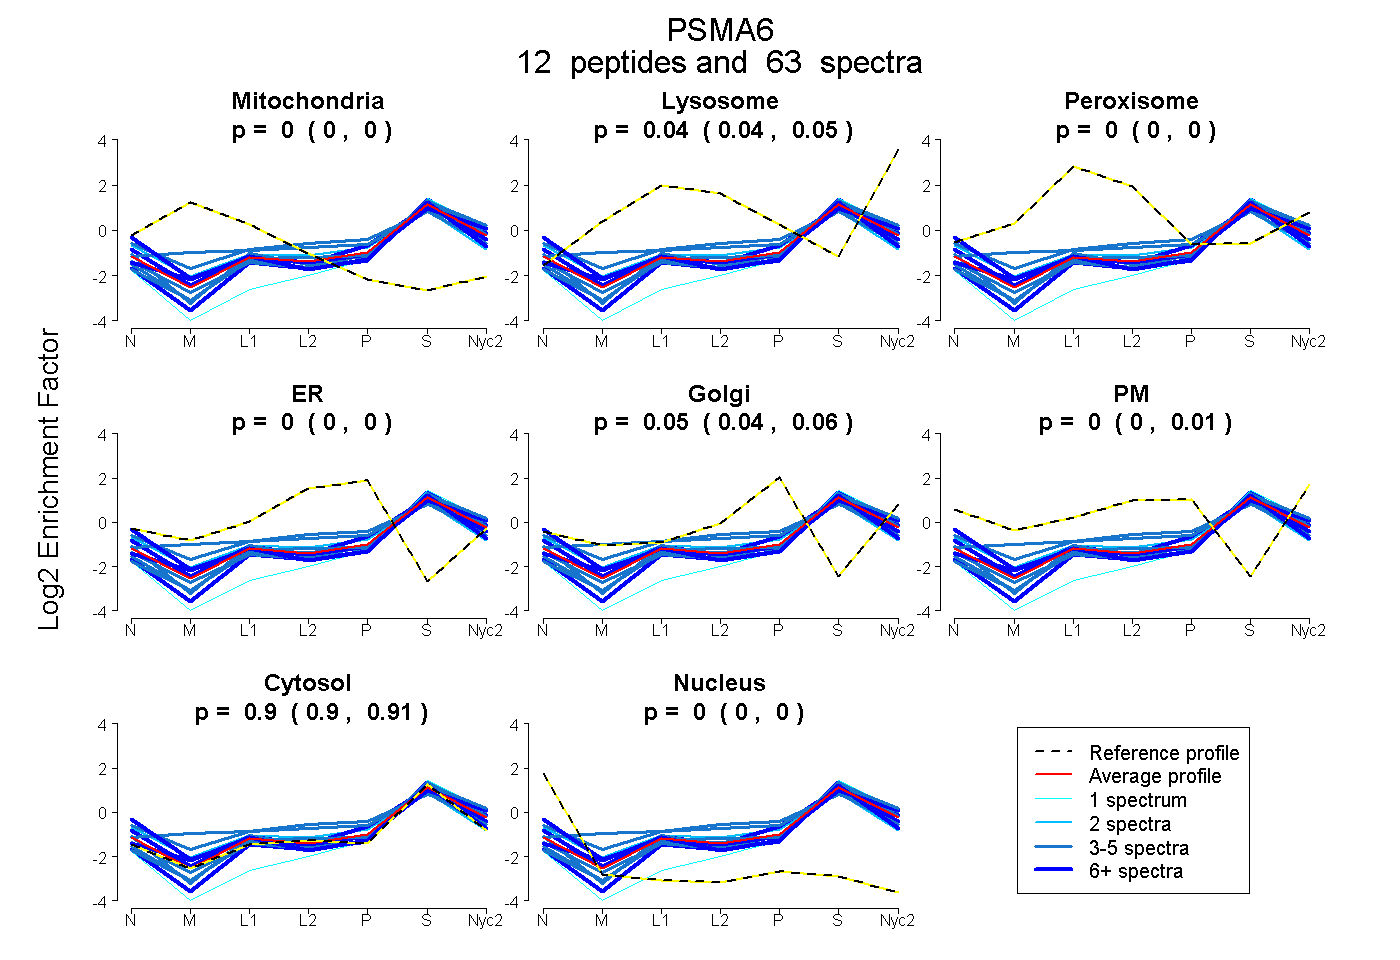
0.000 | 0.000
0.036 | 0.046
0.000 | 0.000
0.000 | 0.000
0.044 | 0.057
0.000 | 0.009
0.900 | 0.908
0.000 | 0.000
4peptides
spectra
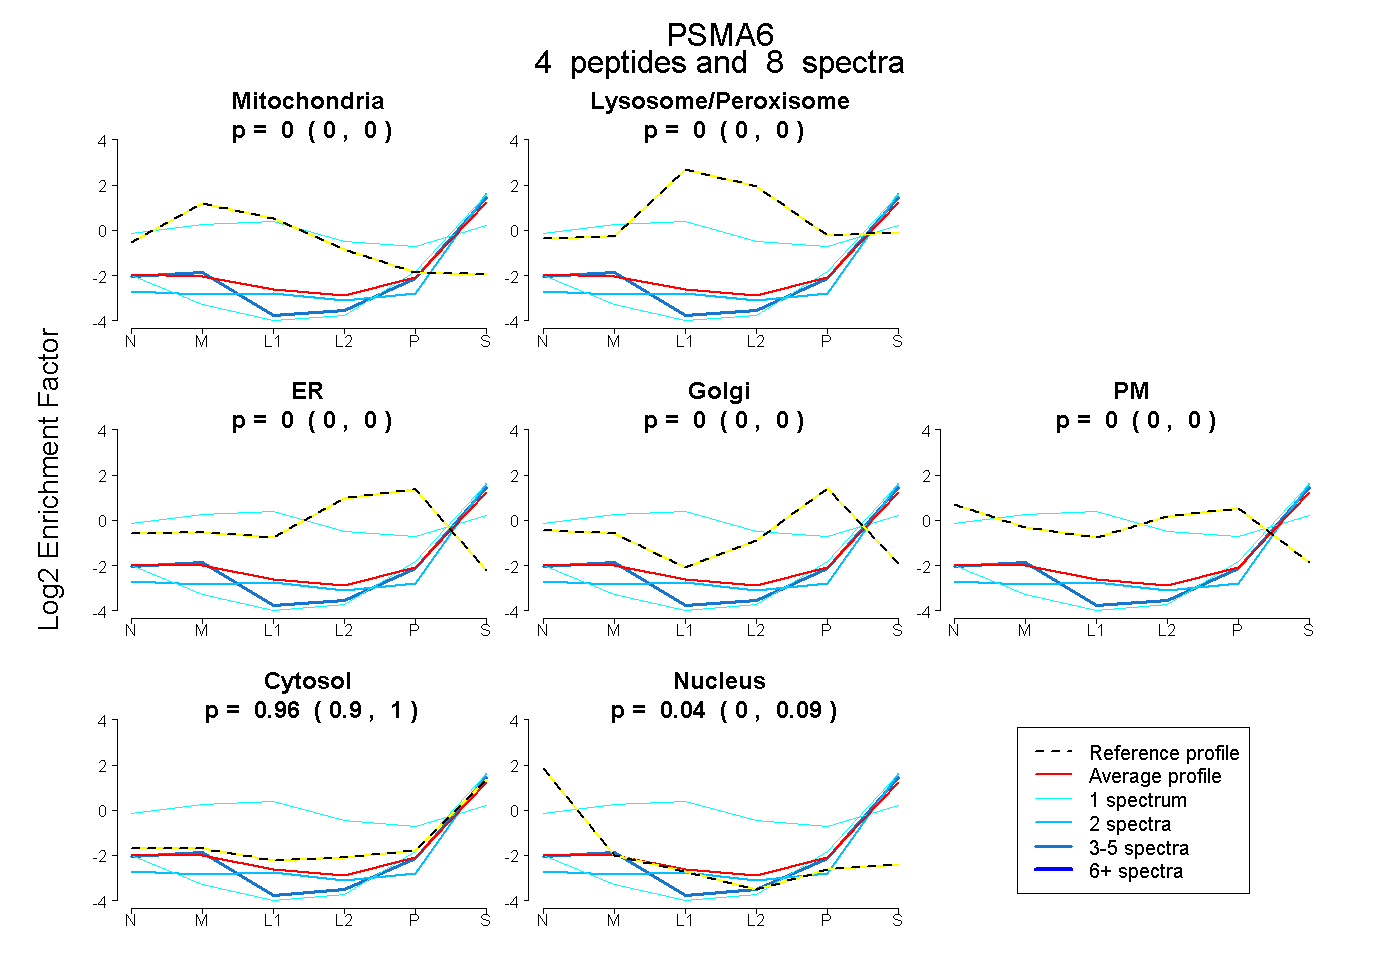
0.000 | 0.000
0.000 | 0.000
0.000 | 0.000
0.000 | 0.000
0.000 | 0.000
0.903 | 1.000
0.000 | 0.088
9peptides
spectra
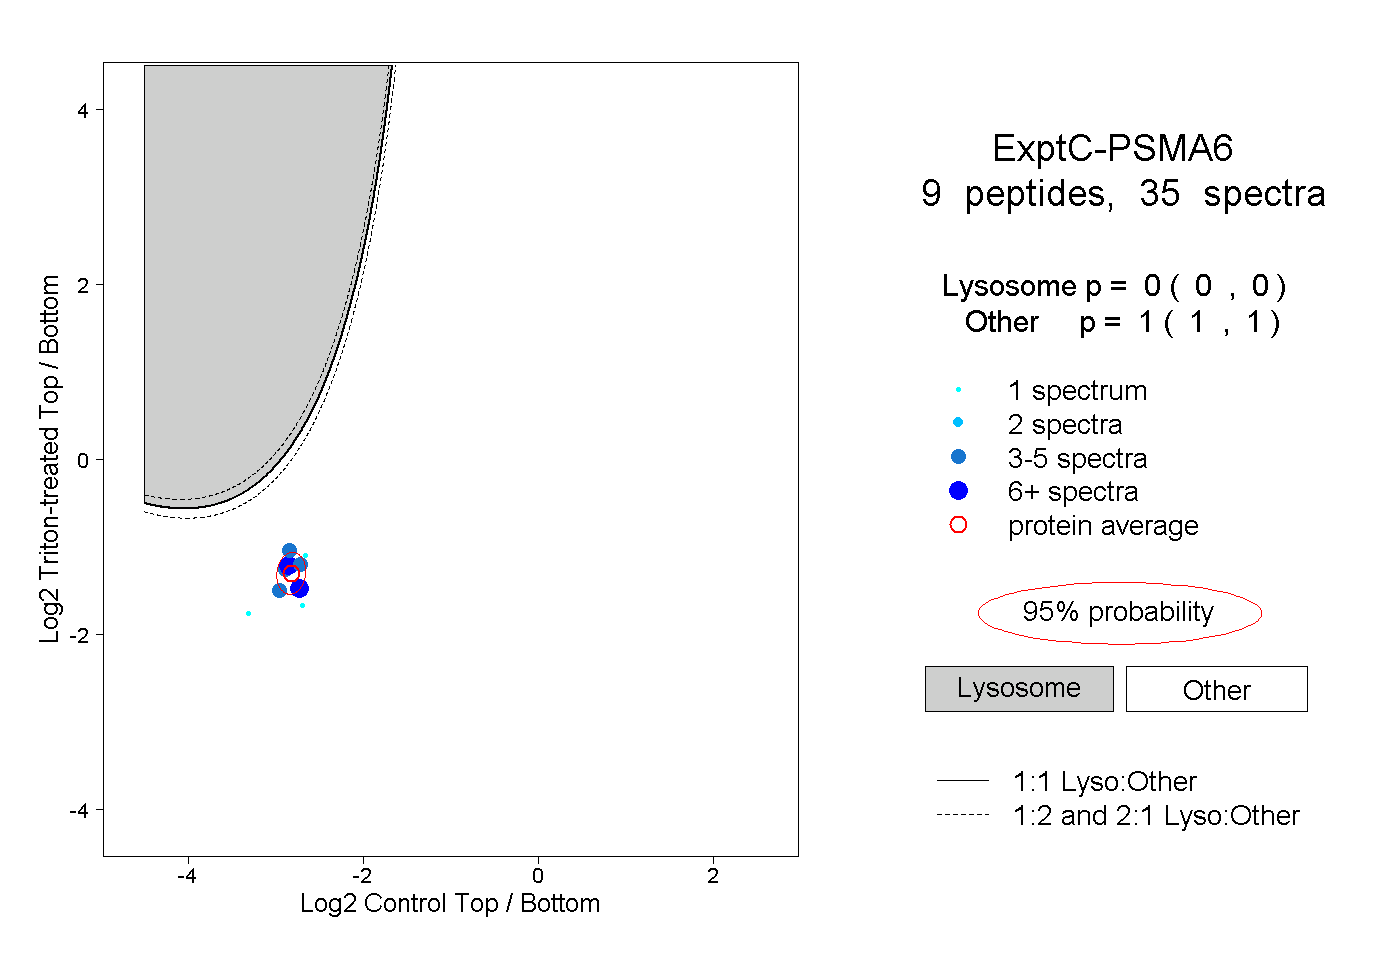
0.000 | 0.000
1.000 | 1.000
2peptides
spectra
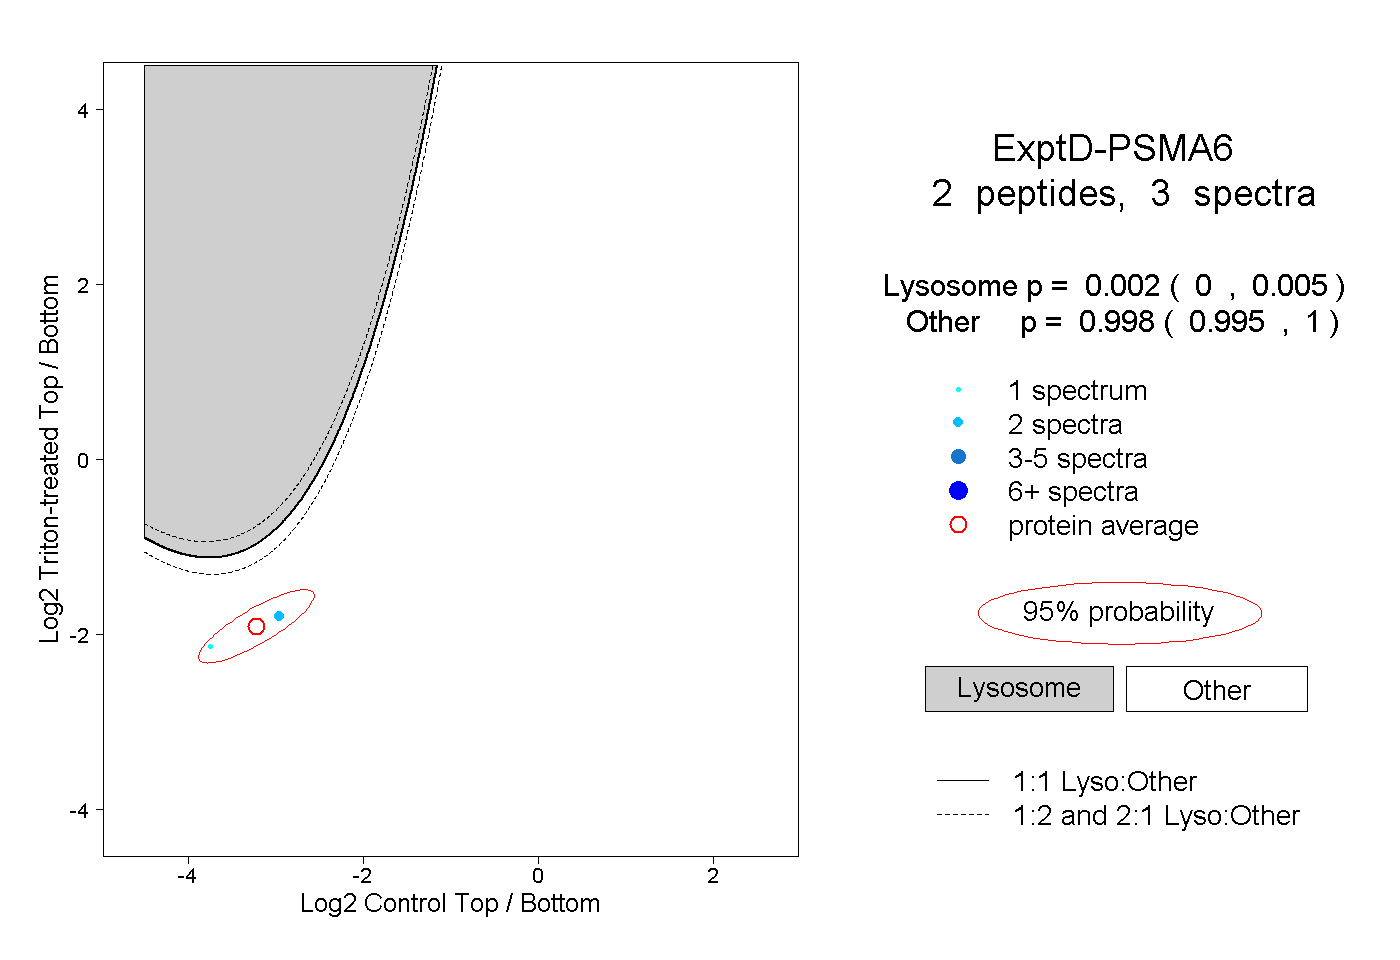
0.000 | 0.005
0.995 | 1.000