 12
12peptides
spectra
0.000 | 0.000
0.036 | 0.046
0.000 | 0.000
0.000 | 0.000
0.044 | 0.057
0.000 | 0.009
0.900 | 0.908
0.000 | 0.000
| Plot | Mito | Lyso | Perox | ER | Golgi | PM | Cytosol | Nucleus | |||||
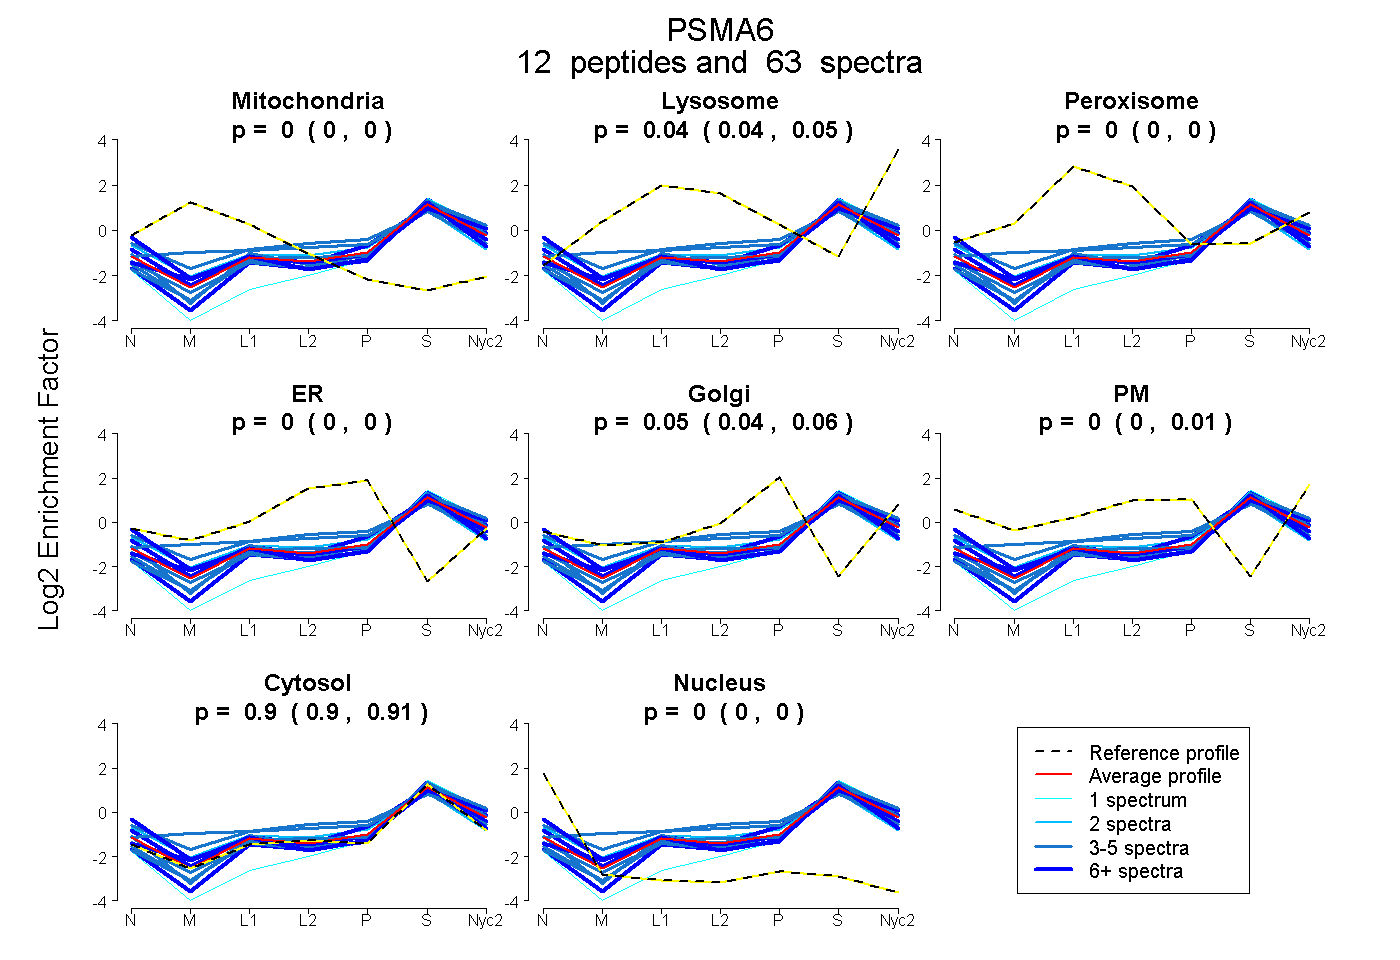
| Expt A |
12 peptides |
63 spectra |
|
0.000 0.000 | 0.000 |
0.043 0.036 | 0.046 |
0.000 0.000 | 0.000 |
0.000 0.000 | 0.000 |
0.053 0.044 | 0.057 |
0.000 0.000 | 0.009 |
0.904 0.900 | 0.908 |
0.000 0.000 | 0.000 |
| 6 spectra, YGYEIPVDMLCK | 0.039 | 0.012 | 0.000 | 0.000 | 0.000 | 0.000 | 0.949 | 0.000 | ||
| 2 spectra, CDPAGYYCGFK | 0.000 | 0.000 | 0.079 | 0.000 | 0.089 | 0.007 | 0.773 | 0.051 | ||
| 3 spectra, ITENIGCVMTGMTADSR | 0.000 | 0.030 | 0.034 | 0.000 | 0.000 | 0.234 | 0.702 | 0.000 | ||
| 4 spectra, ATAAGVK | 0.000 | 0.013 | 0.000 | 0.000 | 0.029 | 0.000 | 0.958 | 0.000 | ||
| 7 spectra, AINQGGLTSVAVR | 0.000 | 0.000 | 0.000 | 0.000 | 0.000 | 0.000 | 1.000 | 0.000 | ||
| 3 spectra, YEAANWK | 0.000 | 0.075 | 0.000 | 0.000 | 0.000 | 0.000 | 0.925 | 0.000 | ||
| 5 spectra, LYQVEYAFK | 0.000 | 0.044 | 0.000 | 0.000 | 0.000 | 0.000 | 0.956 | 0.000 | ||
| 8 spectra, QTESTSFLEK | 0.000 | 0.000 | 0.000 | 0.000 | 0.000 | 0.167 | 0.813 | 0.020 | ||
| 5 spectra, LLDSSTVTHLFK | 0.000 | 0.018 | 0.000 | 0.000 | 0.008 | 0.018 | 0.956 | 0.000 | ||
| 14 spectra, GSSAGFDR | 0.000 | 0.000 | 0.000 | 0.000 | 0.098 | 0.040 | 0.861 | 0.000 | ||
| 5 spectra, HITIFSPEGR | 0.082 | 0.032 | 0.112 | 0.000 | 0.094 | 0.000 | 0.679 | 0.000 | ||
| 1 spectrum, ILTEAEIDAHLVALAER | 0.000 | 0.000 | 0.000 | 0.000 | 0.000 | 0.000 | 1.000 | 0.000 |
| Plot | Mito | Lyso or Perox | ER | Golgi | PM | Cytosol | Nucleus | ||||||
| Expt B |
4 peptides |
8 spectra |
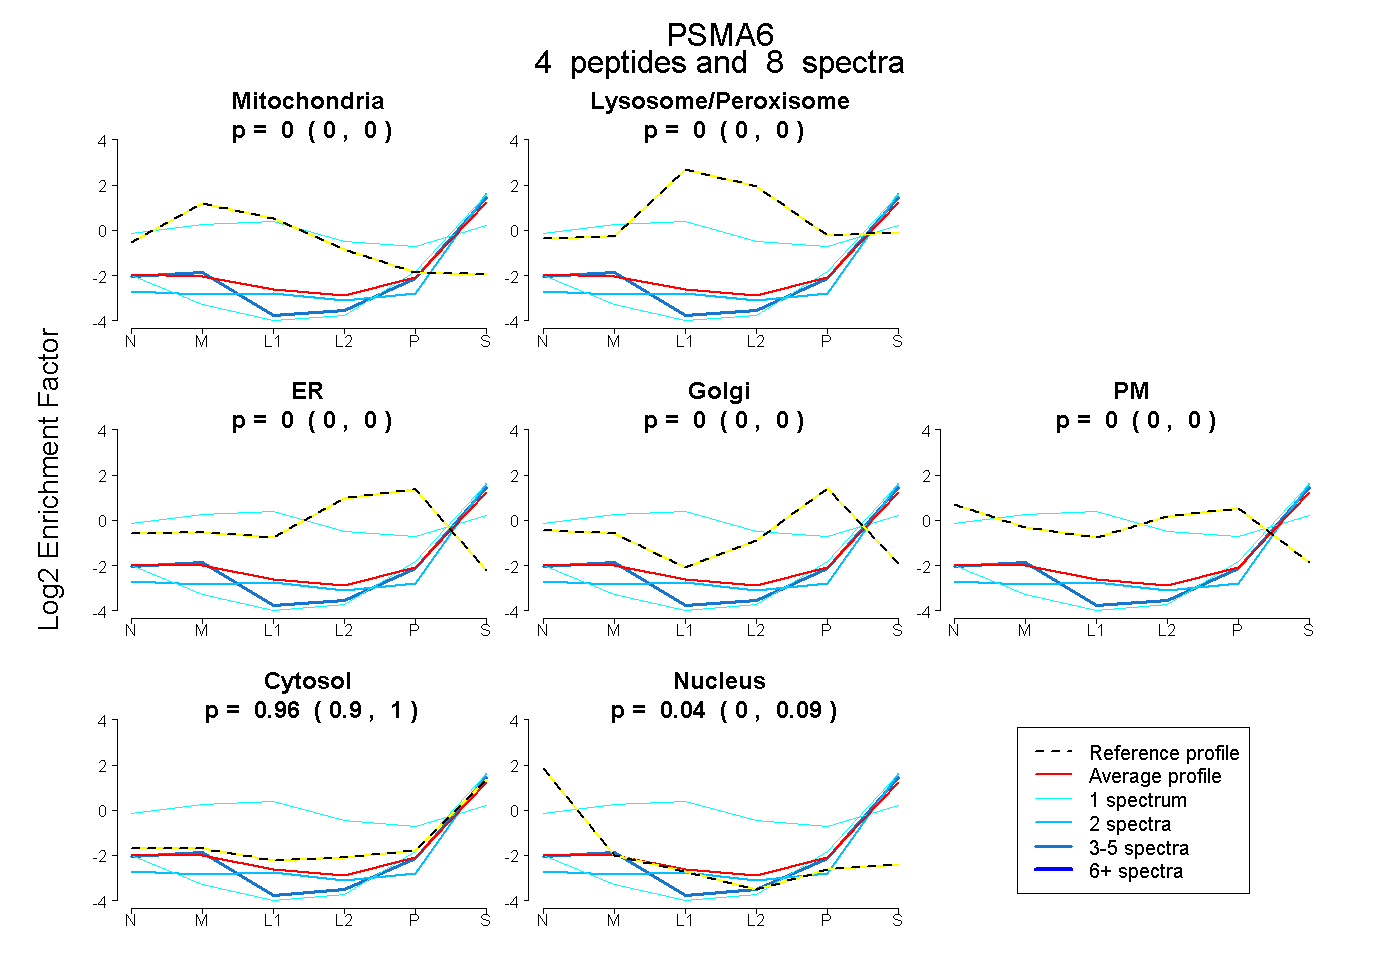 |
0.000 0.000 | 0.000 |
0.000 0.000 | 0.000 |
0.000 0.000 | 0.000 |
0.000 0.000 | 0.000 |
0.000 0.000 | 0.000 |
0.957 0.903 | 1.000 |
0.043 0.000 | 0.088 |
|||
| Plot | Lyso | Other | |||||||||||
| Expt C |
9 peptides |
35 spectra |
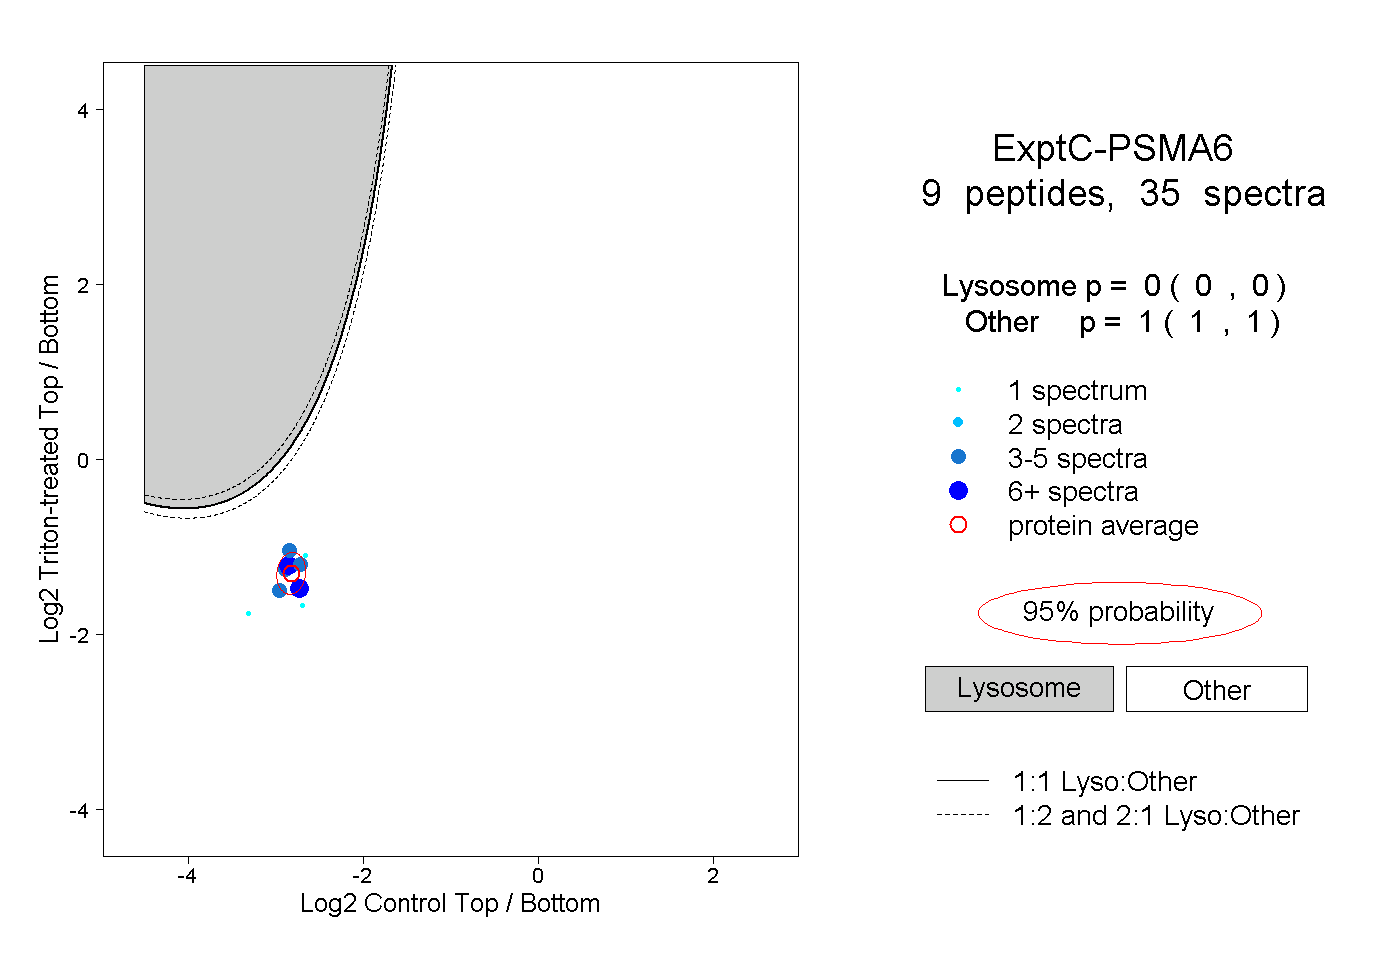 |
0.000 0.000 | 0.000 |
1.000 1.000 | 1.000 |
||||||||
| Plot | Lyso | Other | |||||||||||
| Expt D |
2 peptides |
3 spectra |
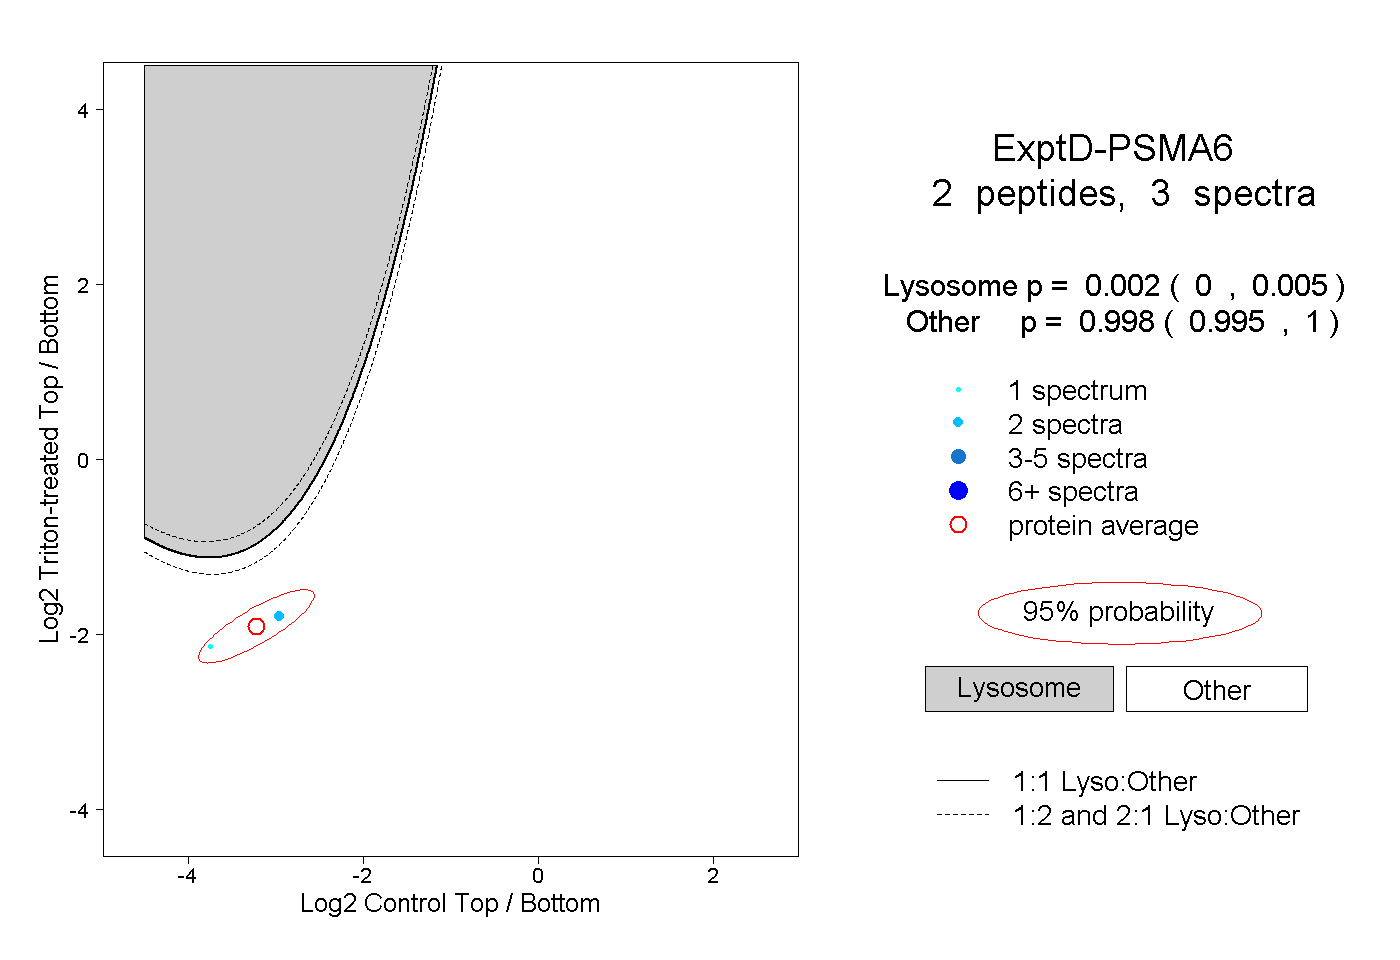 |
0.002 0.000 | 0.005 |
0.998 0.995 | 1.000 |