 11
11peptides
spectra
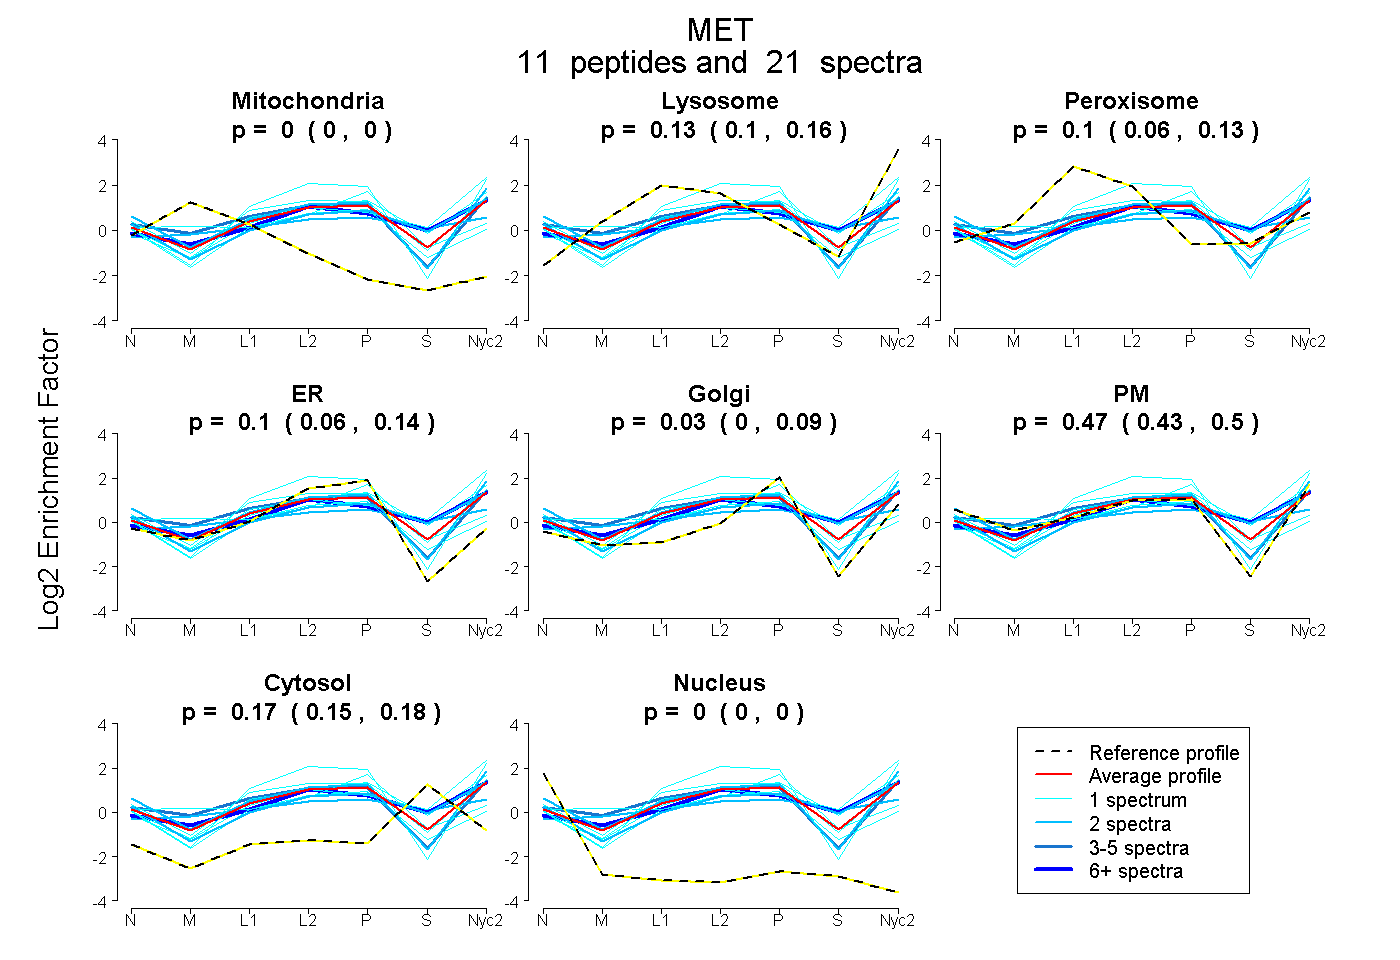
0.000 | 0.000
0.101 | 0.158
0.064 | 0.132
0.056 | 0.136
0.000 | 0.087
0.426 | 0.499
0.149 | 0.181
0.000 | 0.000
4peptides
spectra
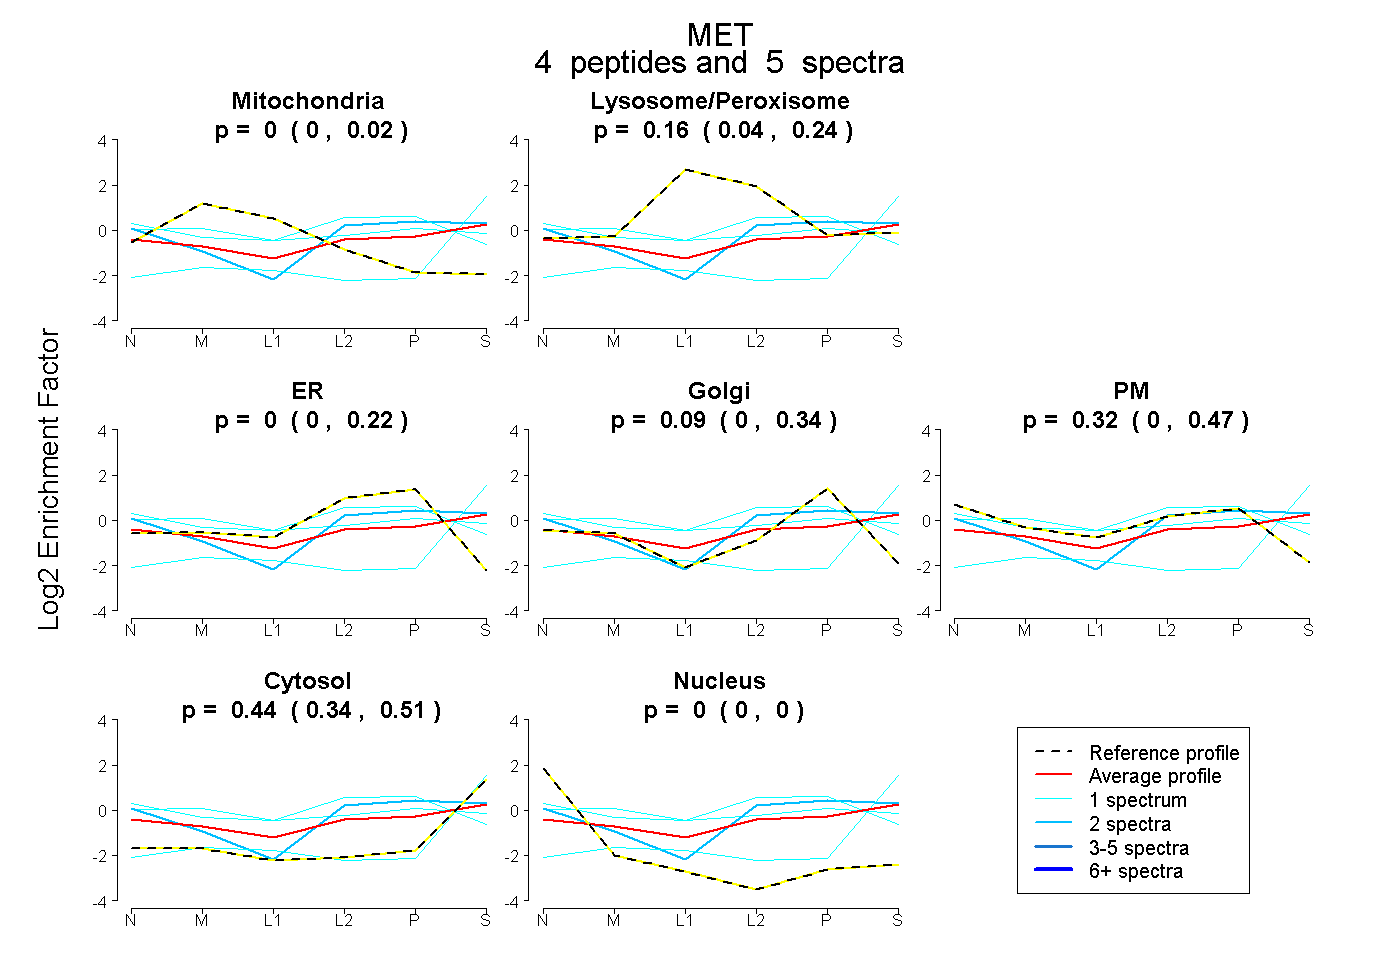
0.000 | 0.015
0.040 | 0.245
0.000 | 0.219
0.000 | 0.342
0.000 | 0.472
0.336 | 0.514
0.000 | 0.000
15peptides
spectra
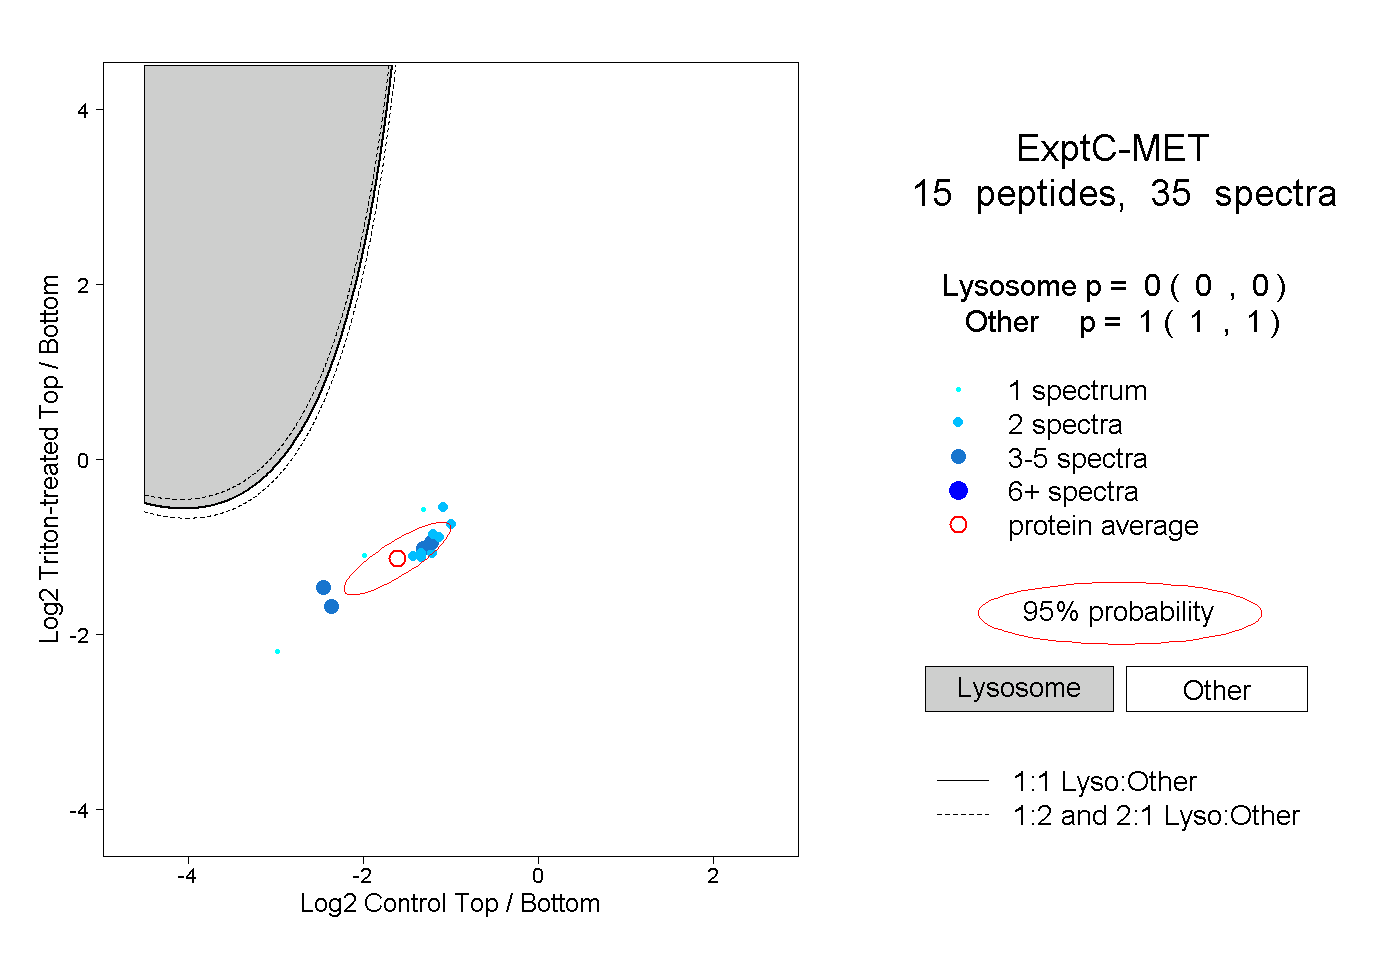
0.000 | 0.000
1.000 | 1.000
3peptides
spectra
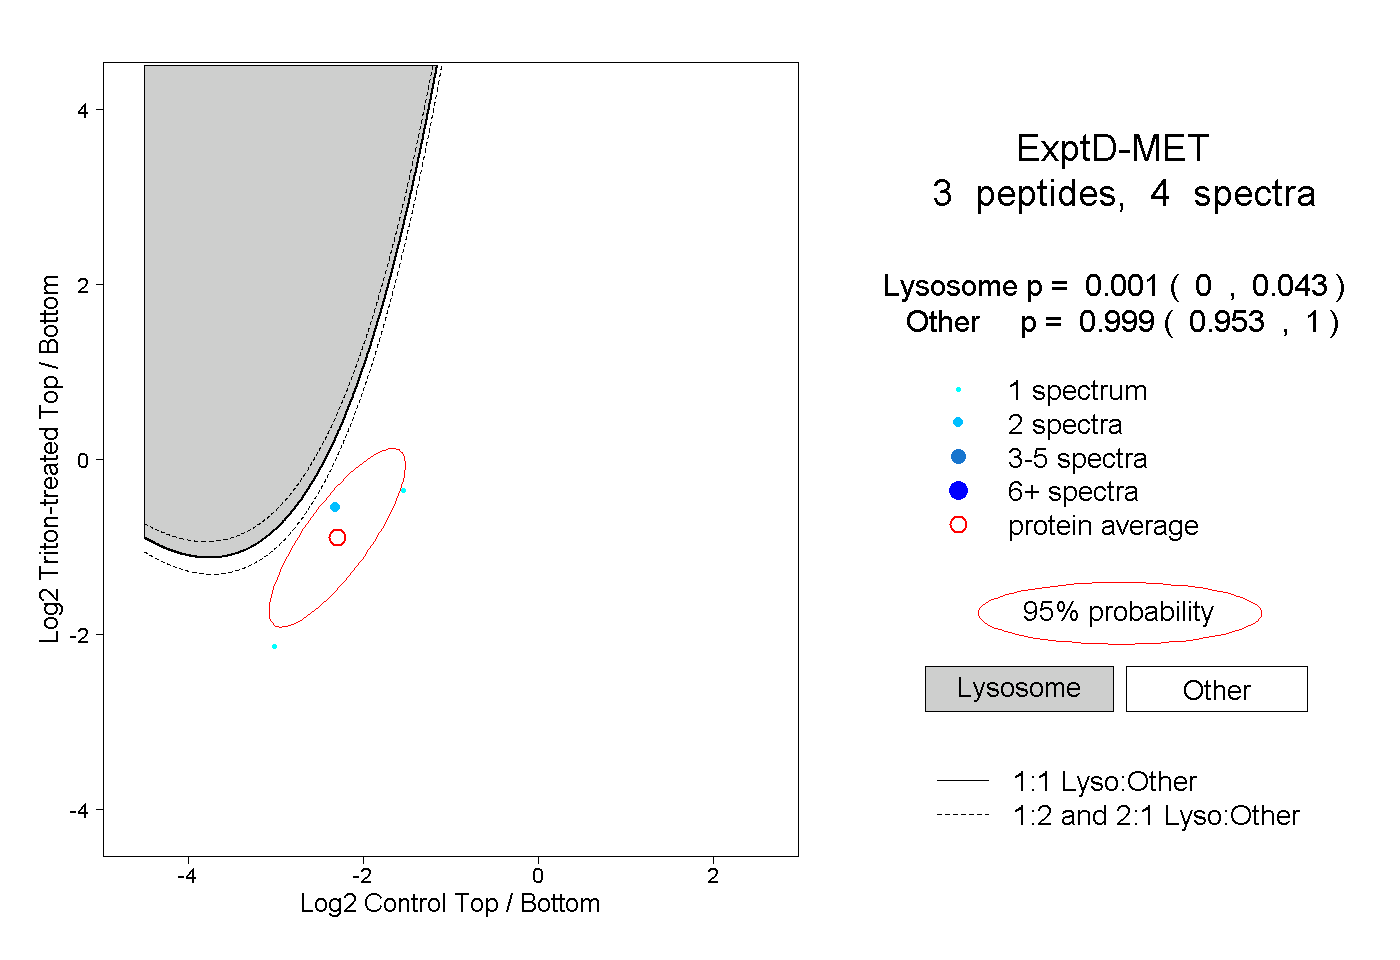
0.000 | 0.043
0.953 | 1.000