 11
11peptides
spectra
0.000 | 0.000
0.101 | 0.158
0.064 | 0.132
0.056 | 0.136
0.000 | 0.087
0.426 | 0.499
0.149 | 0.181
0.000 | 0.000
| Plot | Mito | Lyso | Perox | ER | Golgi | PM | Cytosol | Nucleus | |||||
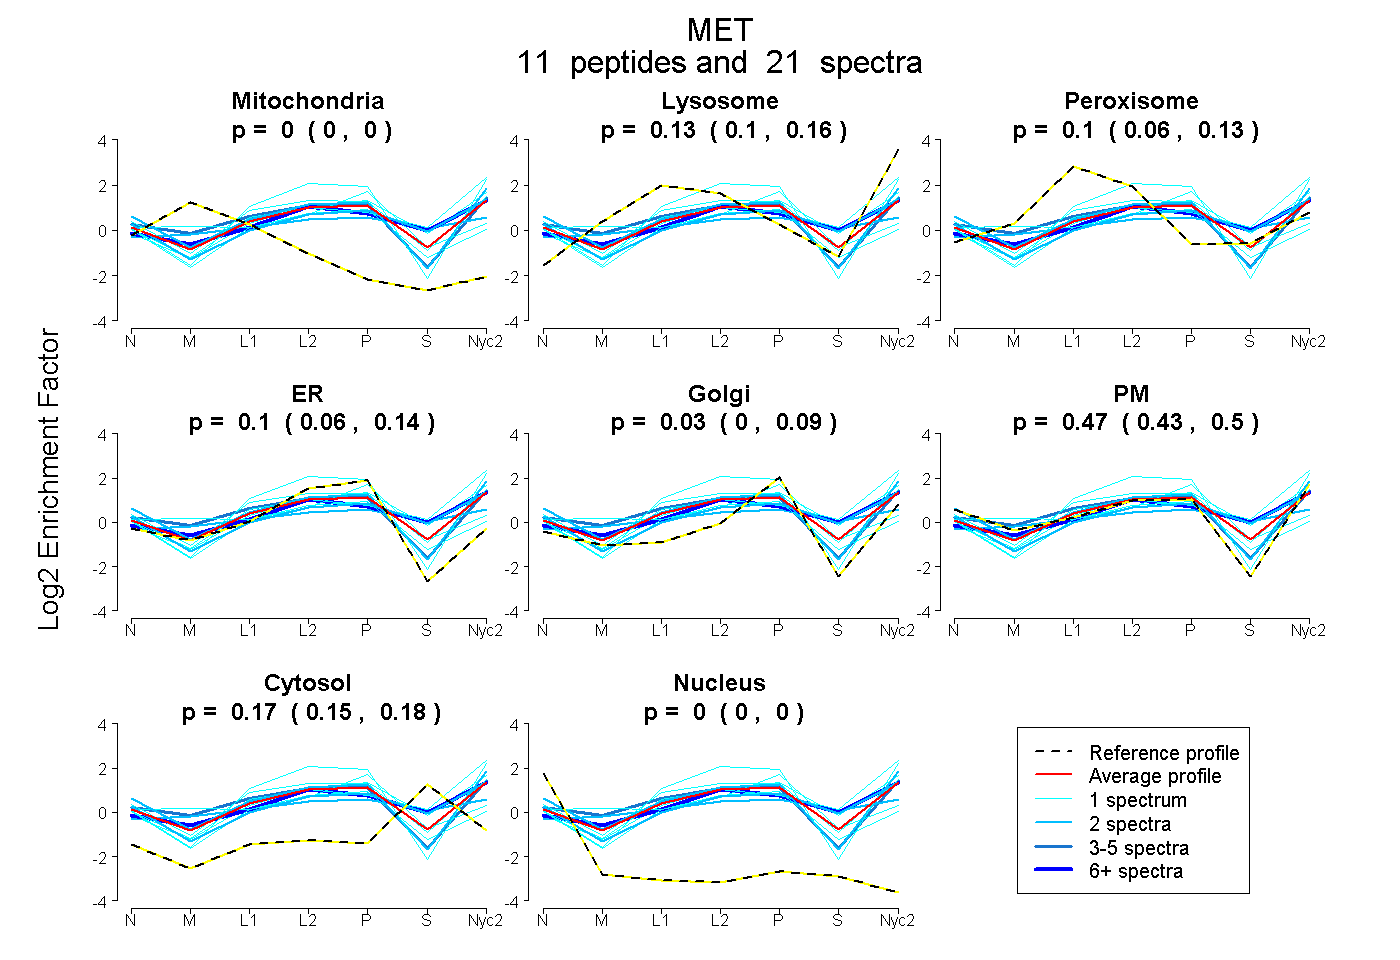
| Expt A |
11 peptides |
21 spectra |
|
0.000 0.000 | 0.000 |
0.133 0.101 | 0.158 |
0.095 0.064 | 0.132 |
0.104 0.056 | 0.136 |
0.028 0.000 | 0.087 |
0.471 0.426 | 0.499 |
0.169 0.149 | 0.181 |
0.000 0.000 | 0.000 |
| 1 spectrum, GDDIDPEAVK | 0.000 | 0.000 | 0.115 | 0.342 | 0.272 | 0.069 | 0.202 | 0.000 | ||
| 1 spectrum, IHCAVK | 0.109 | 0.000 | 0.196 | 0.265 | 0.157 | 0.186 | 0.087 | 0.000 | ||
| 2 spectra, DSYPIK | 0.000 | 0.043 | 0.337 | 0.000 | 0.257 | 0.093 | 0.269 | 0.000 | ||
| 6 spectra, FMQVVLSR | 0.000 | 0.210 | 0.102 | 0.036 | 0.000 | 0.376 | 0.276 | 0.000 | ||
| 2 spectra, VADFGLAR | 0.000 | 0.074 | 0.025 | 0.000 | 0.000 | 0.858 | 0.042 | 0.000 | ||
| 3 spectra, AEMRPSFSELVSR | 0.000 | 0.044 | 0.216 | 0.000 | 0.172 | 0.568 | 0.000 | 0.000 | ||
| 1 spectrum, GDLTIANLGTSEGR | 0.000 | 0.412 | 0.000 | 0.000 | 0.000 | 0.337 | 0.251 | 0.000 | ||
| 1 spectrum, AFFLLDGILSK | 0.000 | 0.309 | 0.000 | 0.123 | 0.061 | 0.277 | 0.230 | 0.000 | ||
| 1 spectrum, VHTPHLDR | 0.000 | 0.277 | 0.000 | 0.322 | 0.000 | 0.401 | 0.000 | 0.000 | ||
| 1 spectrum, QAVSSTVLGK | 0.000 | 0.094 | 0.173 | 0.110 | 0.000 | 0.533 | 0.090 | 0.000 | ||
| 2 spectra, YVNDFFNK | 0.000 | 0.118 | 0.025 | 0.000 | 0.000 | 0.537 | 0.319 | 0.000 |
| Plot | Mito | Lyso or Perox | ER | Golgi | PM | Cytosol | Nucleus | ||||||
| Expt B |
4 peptides |
5 spectra |
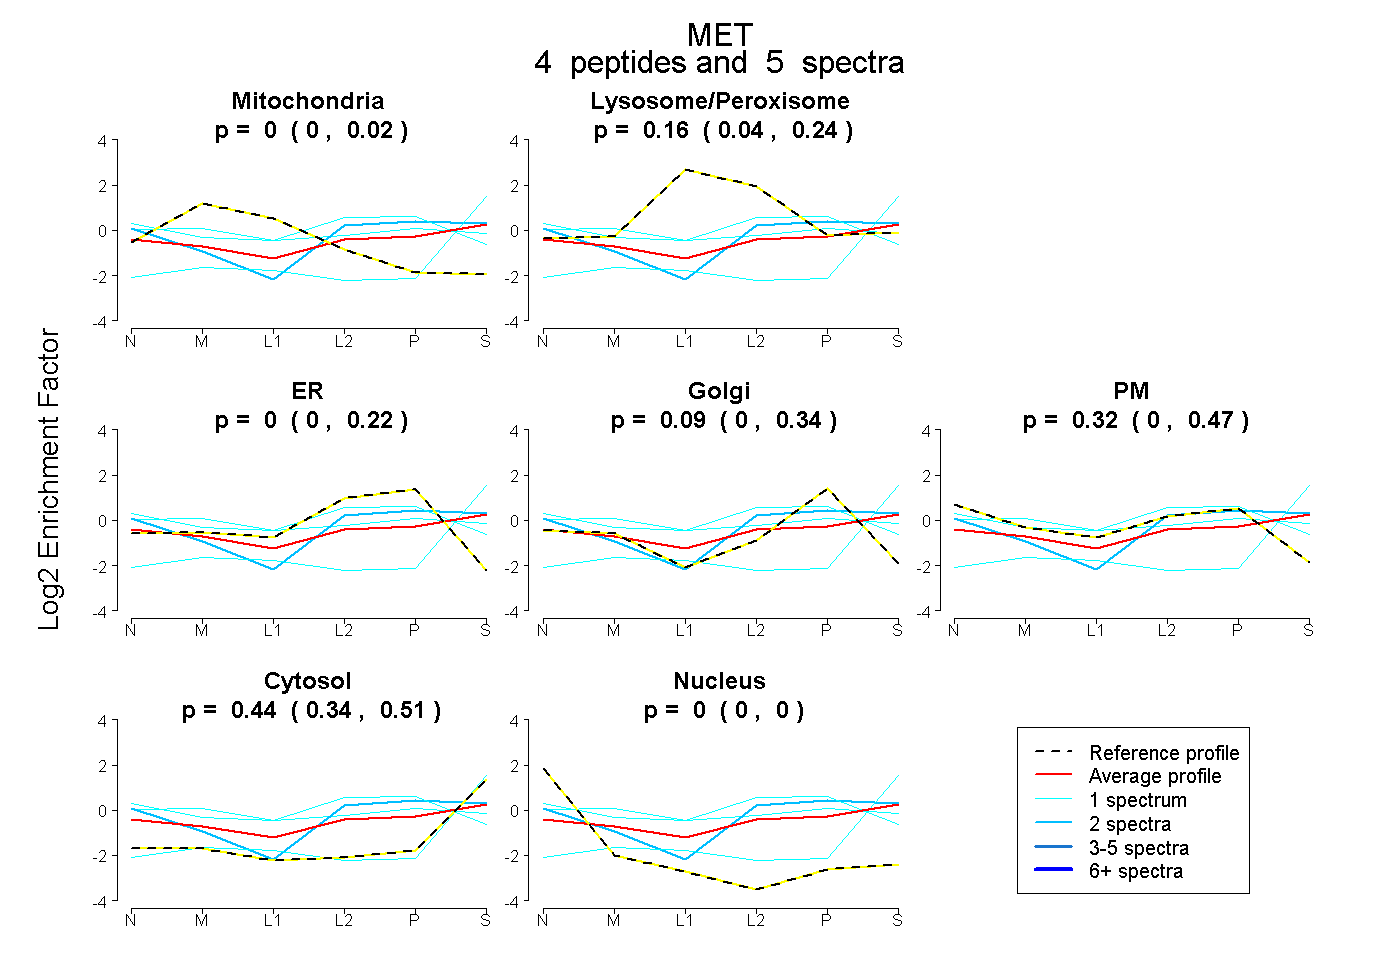 |
0.000 0.000 | 0.015 |
0.155 0.040 | 0.245 |
0.000 0.000 | 0.219 |
0.094 0.000 | 0.342 |
0.316 0.000 | 0.472 |
0.435 0.336 | 0.514 |
0.000 0.000 | 0.000 |
|||
| Plot | Lyso | Other | |||||||||||
| Expt C |
15 peptides |
35 spectra |
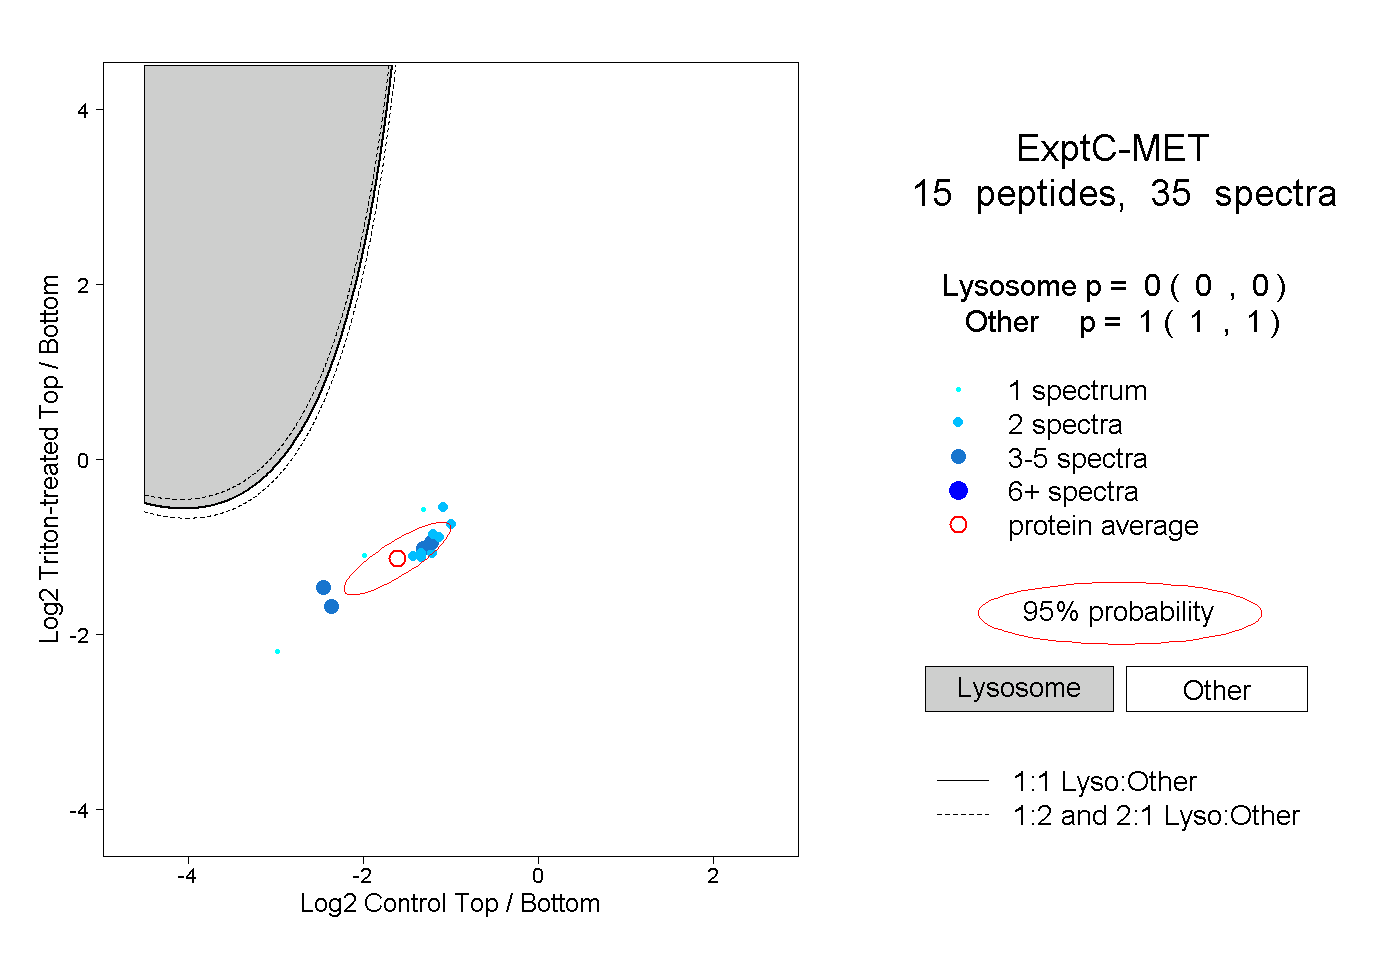 |
0.000 0.000 | 0.000 |
1.000 1.000 | 1.000 |
||||||||
| Plot | Lyso | Other | |||||||||||
| Expt D |
3 peptides |
4 spectra |
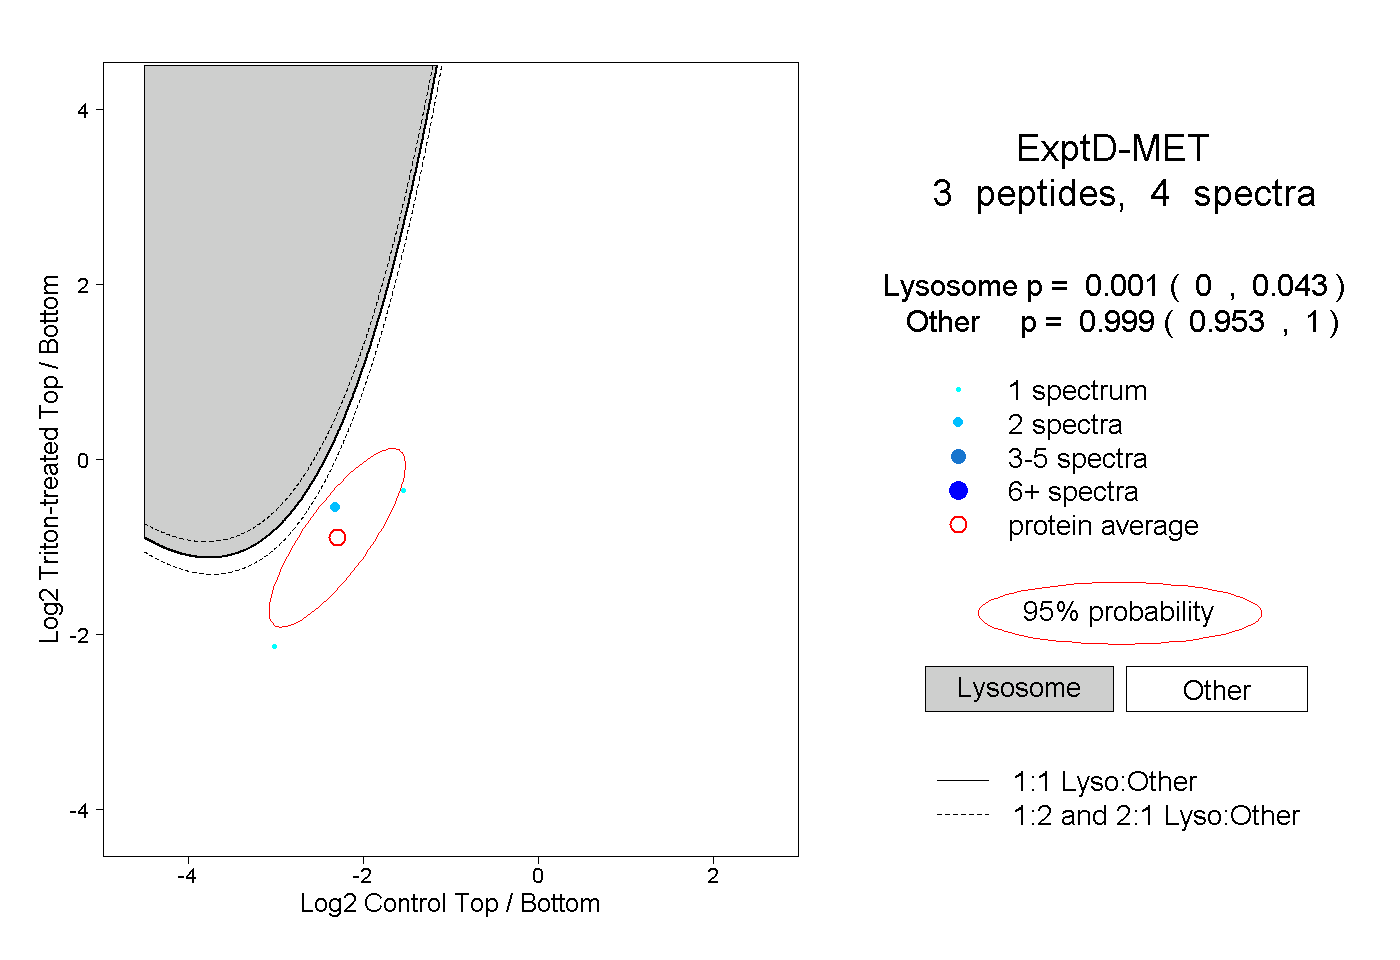 |
0.001 0.000 | 0.043 |
0.999 0.953 | 1.000 |