 12
12peptides
spectra
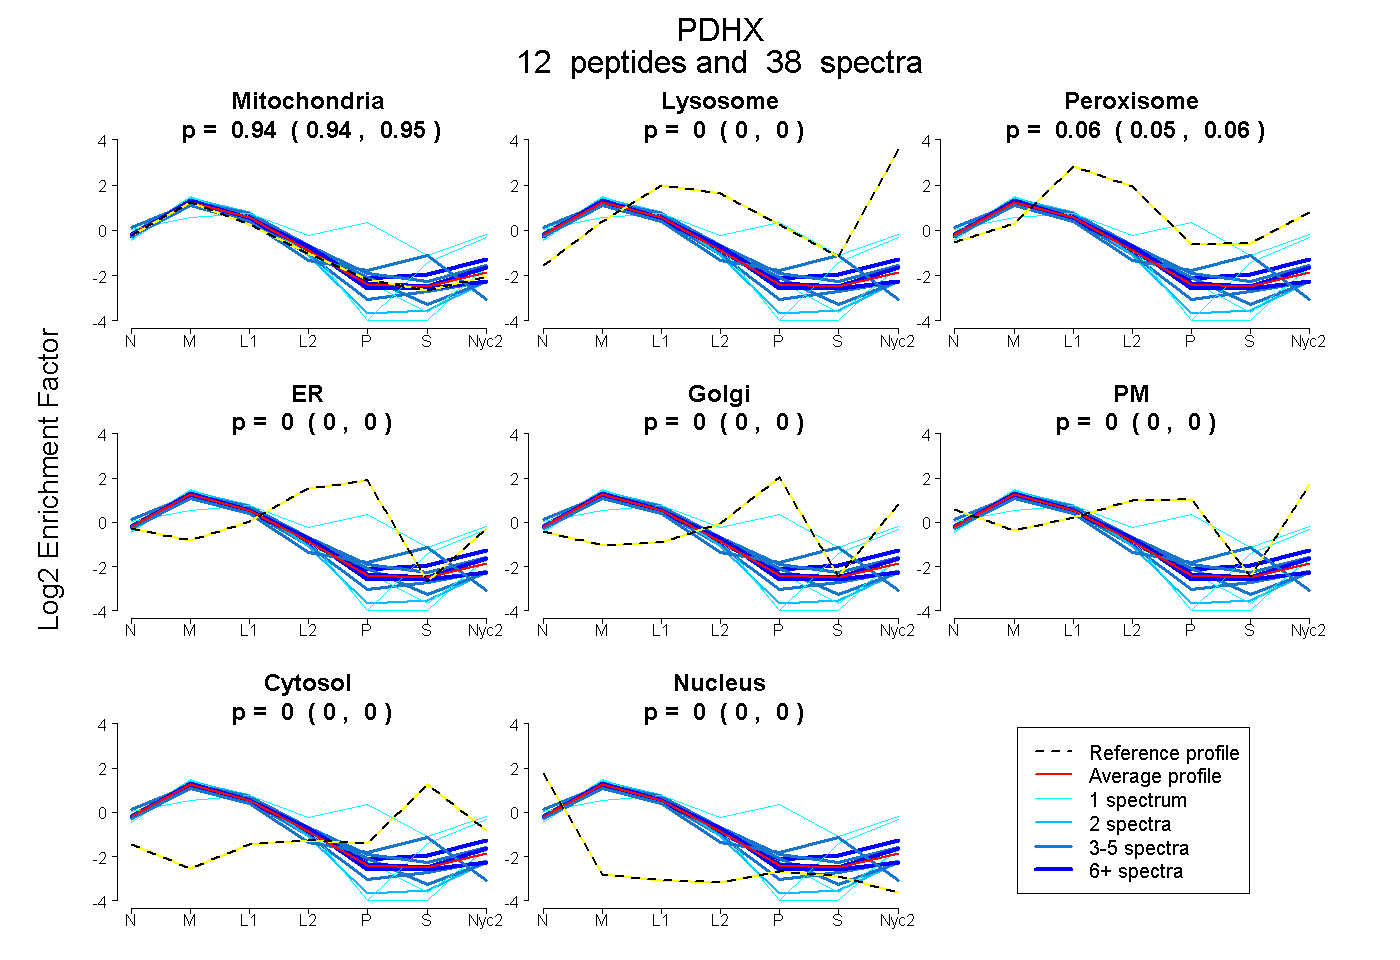
0.935 | 0.952
0.000 | 0.000
0.046 | 0.064
0.000 | 0.000
0.000 | 0.000
0.000 | 0.000
0.000 | 0.000
0.000 | 0.000
9peptides
spectra
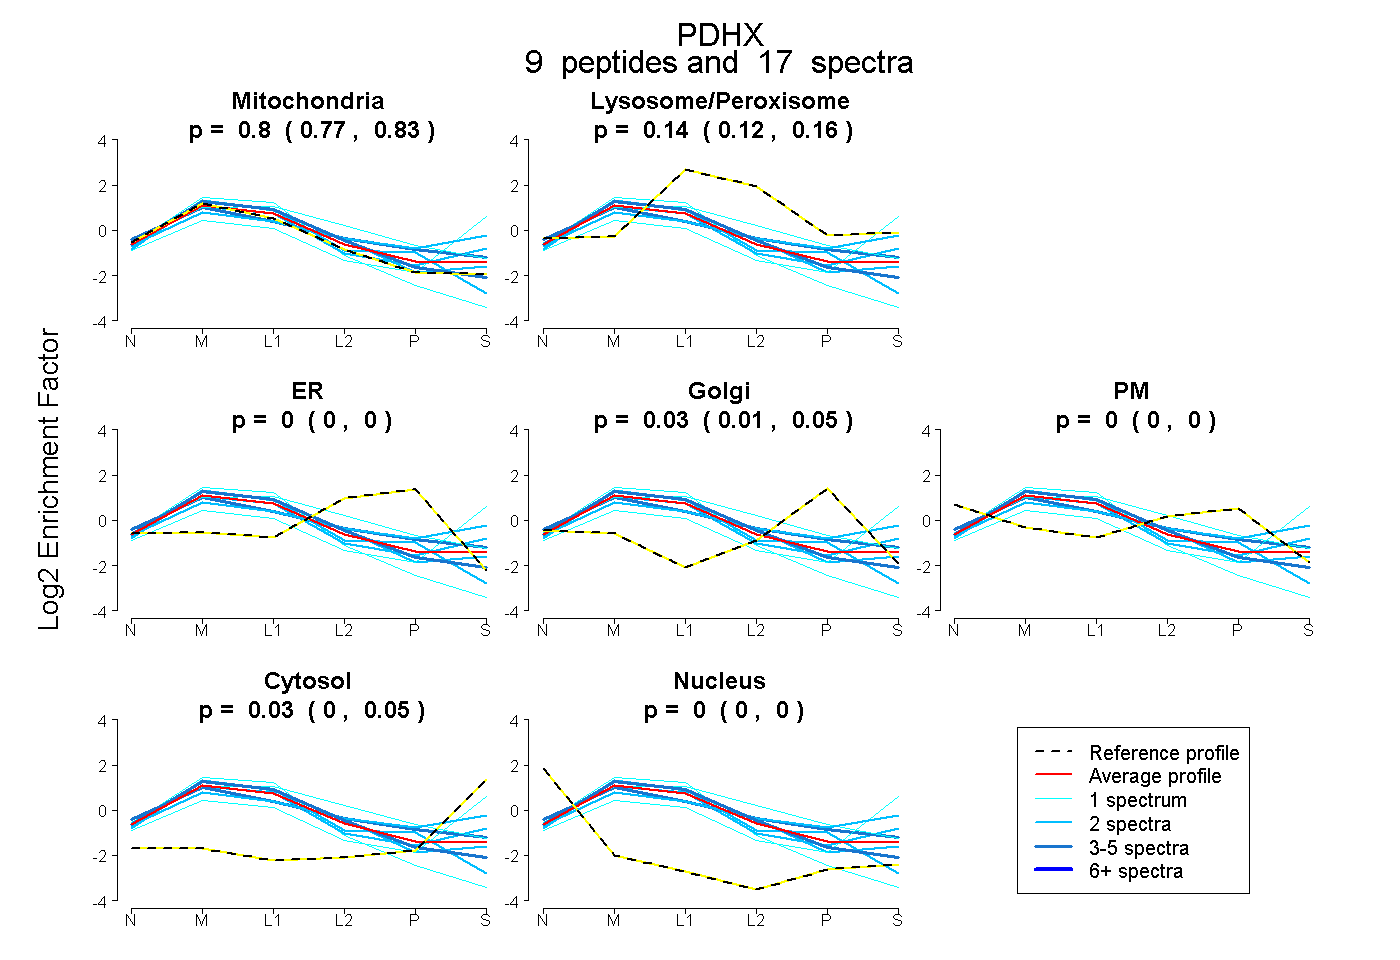
0.768 | 0.826
0.120 | 0.157
0.000 | 0.000
0.006 | 0.052
0.000 | 0.000
0.000 | 0.054
0.000 | 0.000
13peptides
spectra
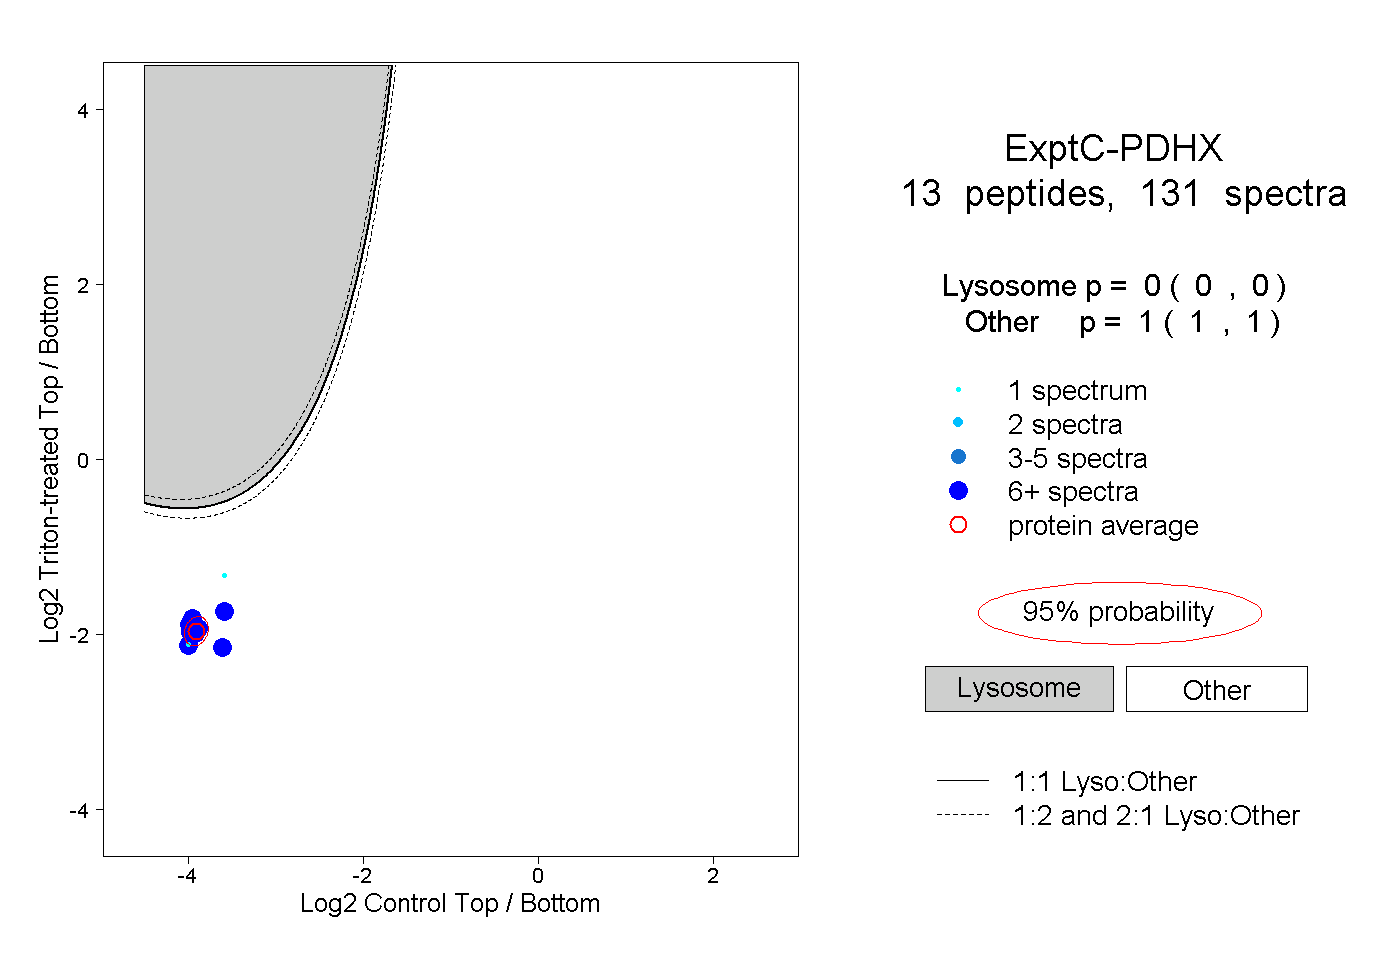
0.000 | 0.000
1.000 | 1.000
7peptides
spectra
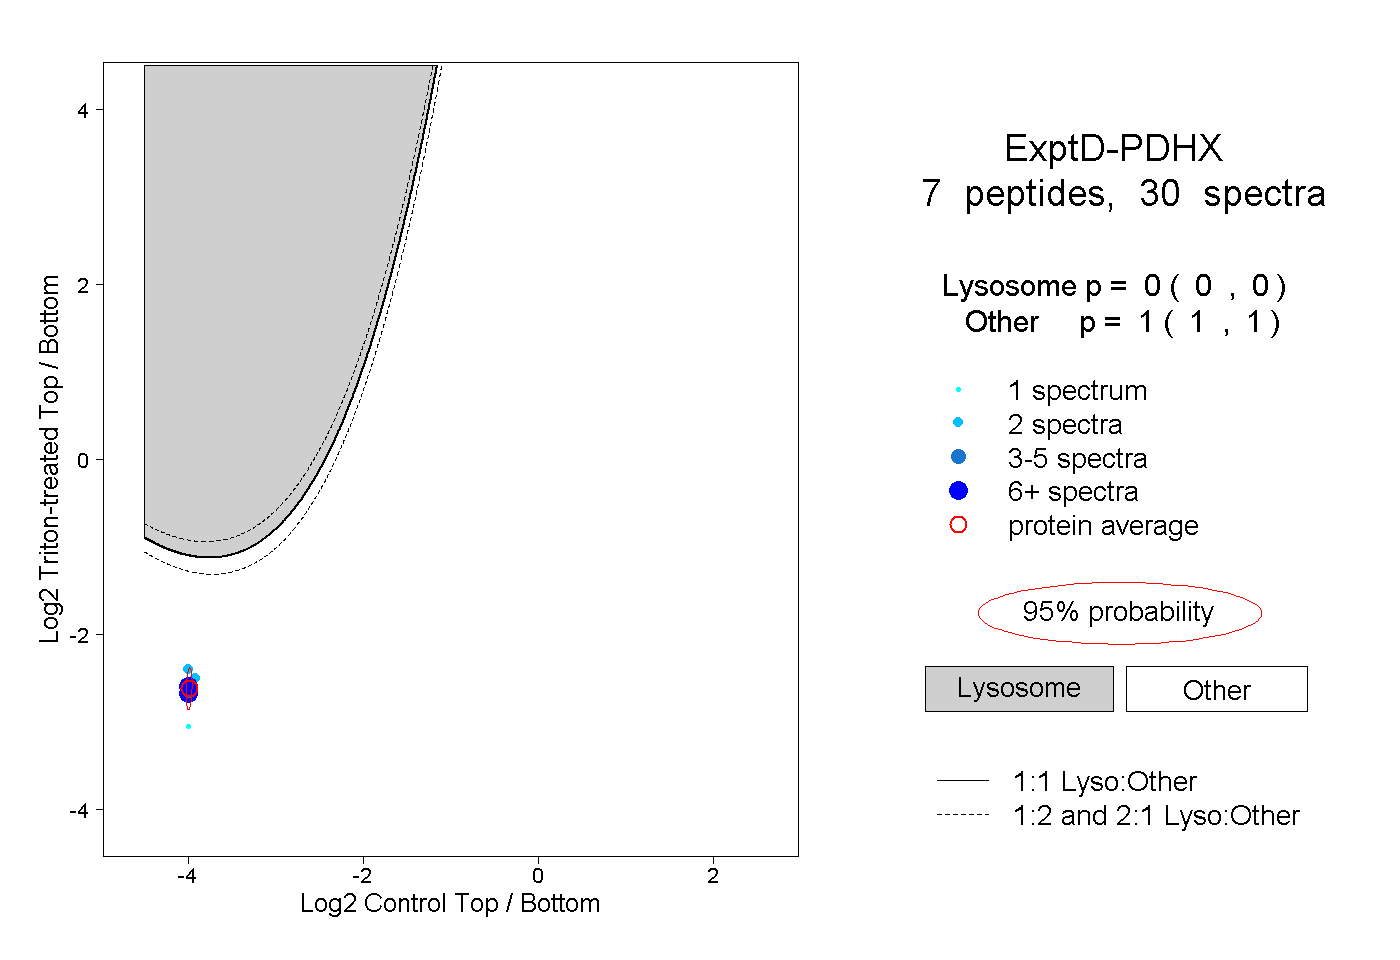
0.000 | 0.000
1.000 | 1.000