 12
12peptides
spectra
0.935 | 0.952
0.000 | 0.000
0.046 | 0.064
0.000 | 0.000
0.000 | 0.000
0.000 | 0.000
0.000 | 0.000
0.000 | 0.000
| Plot | Mito | Lyso | Perox | ER | Golgi | PM | Cytosol | Nucleus | |||||
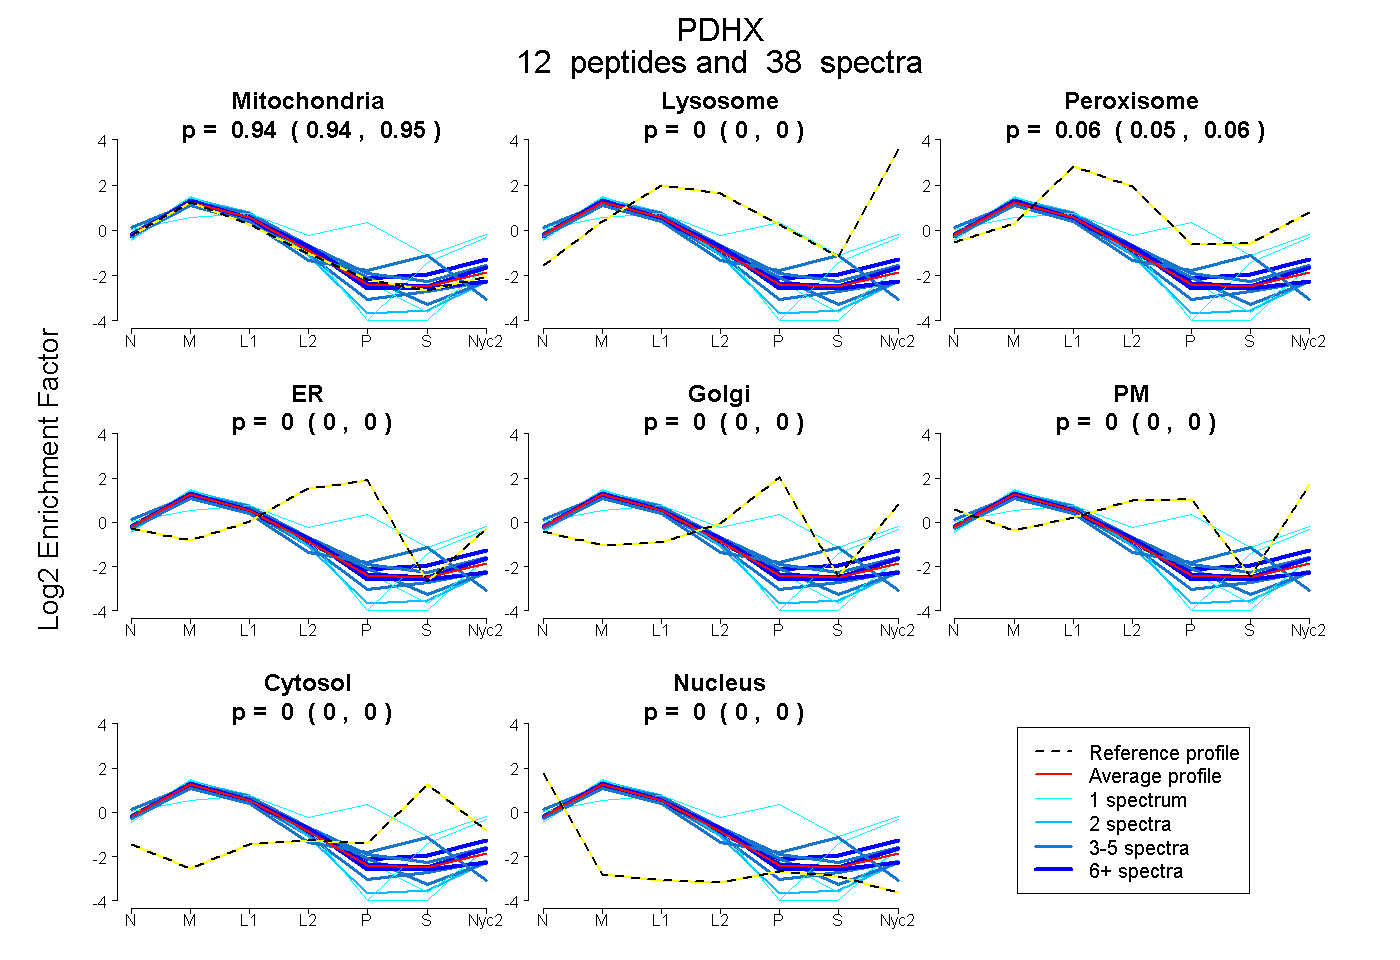
| Expt A |
12 peptides |
38 spectra |
|
0.944 0.935 | 0.952 |
0.000 0.000 | 0.000 |
0.056 0.046 | 0.064 |
0.000 0.000 | 0.000 |
0.000 0.000 | 0.000 |
0.000 0.000 | 0.000 |
0.000 0.000 | 0.000 |
0.000 0.000 | 0.000 |
| 1 spectrum, QHQLITVTMSSDSR | 0.286 | 0.000 | 0.325 | 0.000 | 0.350 | 0.000 | 0.038 | 0.000 | ||
| 4 spectra, FRPVLK | 1.000 | 0.000 | 0.000 | 0.000 | 0.000 | 0.000 | 0.000 | 0.000 | ||
| 6 spectra, TVGTPPR | 0.913 | 0.014 | 0.073 | 0.000 | 0.000 | 0.000 | 0.000 | 0.000 | ||
| 6 spectra, ANLENPMR | 0.835 | 0.059 | 0.071 | 0.000 | 0.000 | 0.000 | 0.035 | 0.000 | ||
| 1 spectrum, QMPGVNVTWDGEGPK | 0.767 | 0.105 | 0.055 | 0.000 | 0.000 | 0.000 | 0.073 | 0.000 | ||
| 1 spectrum, FLETFK | 1.000 | 0.000 | 0.000 | 0.000 | 0.000 | 0.000 | 0.000 | 0.000 | ||
| 3 spectra, LSPAAR | 0.846 | 0.001 | 0.153 | 0.000 | 0.000 | 0.000 | 0.000 | 0.000 | ||
| 2 spectra, GLITPIIK | 1.000 | 0.000 | 0.000 | 0.000 | 0.000 | 0.000 | 0.000 | 0.000 | ||
| 1 spectrum, HVEIPK | 0.980 | 0.020 | 0.000 | 0.000 | 0.000 | 0.000 | 0.000 | 0.000 | ||
| 3 spectra, HSLDASQGTATGPR | 0.978 | 0.000 | 0.000 | 0.021 | 0.000 | 0.000 | 0.000 | 0.002 | ||
| 6 spectra, LTEDEEGNPQVR | 0.991 | 0.000 | 0.009 | 0.000 | 0.000 | 0.000 | 0.000 | 0.000 | ||
| 4 spectra, VSVNDFIIR | 0.847 | 0.000 | 0.000 | 0.000 | 0.000 | 0.000 | 0.153 | 0.000 |
| Plot | Mito | Lyso or Perox | ER | Golgi | PM | Cytosol | Nucleus | ||||||
| Expt B |
9 peptides |
17 spectra |
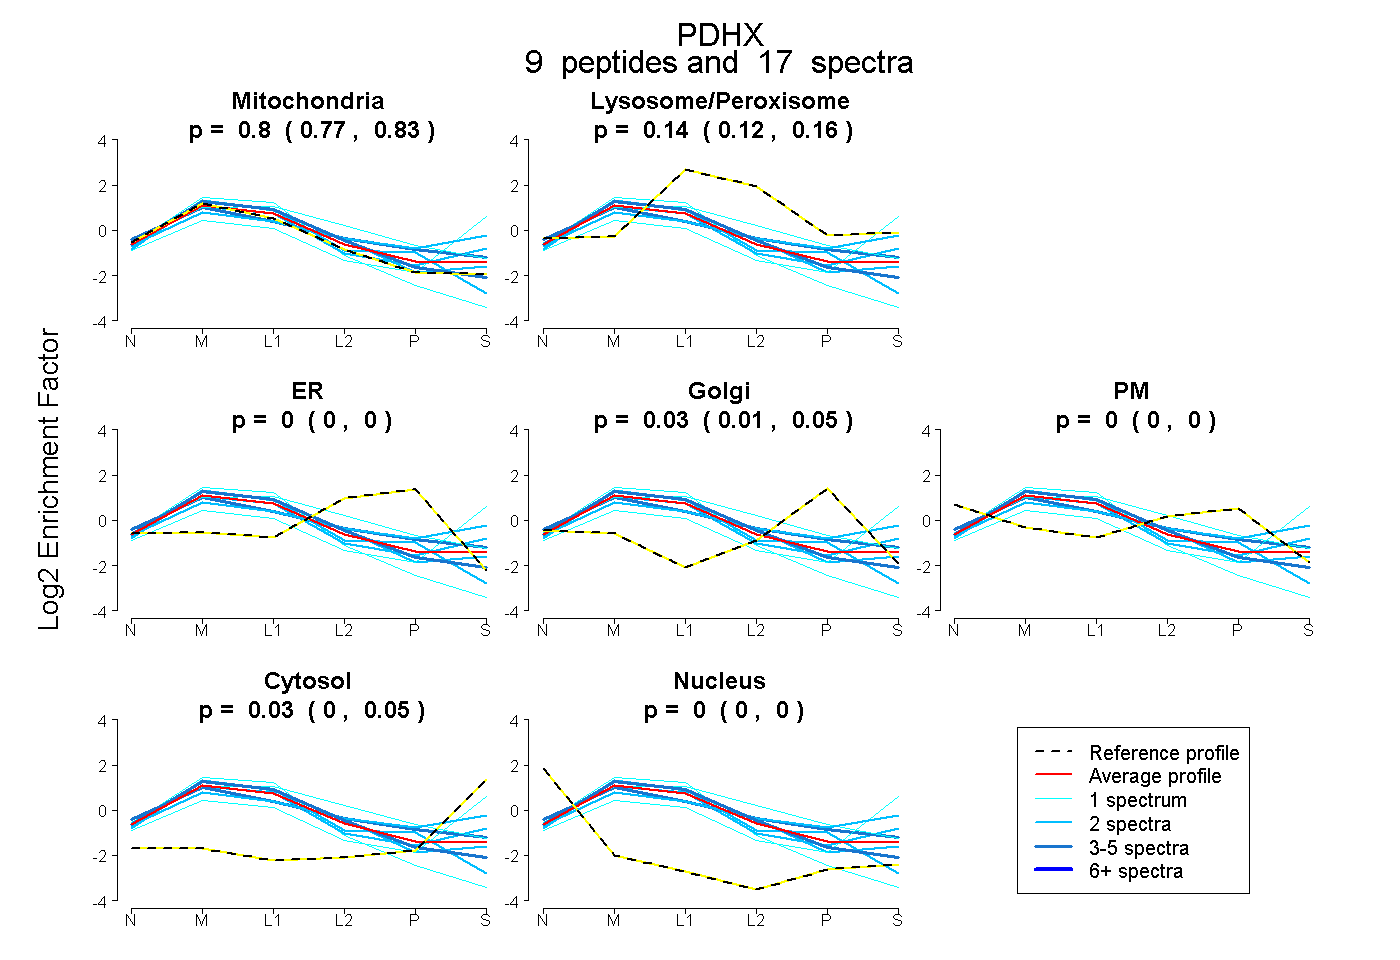 |
0.800 0.768 | 0.826 |
0.139 0.120 | 0.157 |
0.000 0.000 | 0.000 |
0.032 0.006 | 0.052 |
0.000 0.000 | 0.000 |
0.029 0.000 | 0.054 |
0.000 0.000 | 0.000 |
|||
| Plot | Lyso | Other | |||||||||||
| Expt C |
13 peptides |
131 spectra |
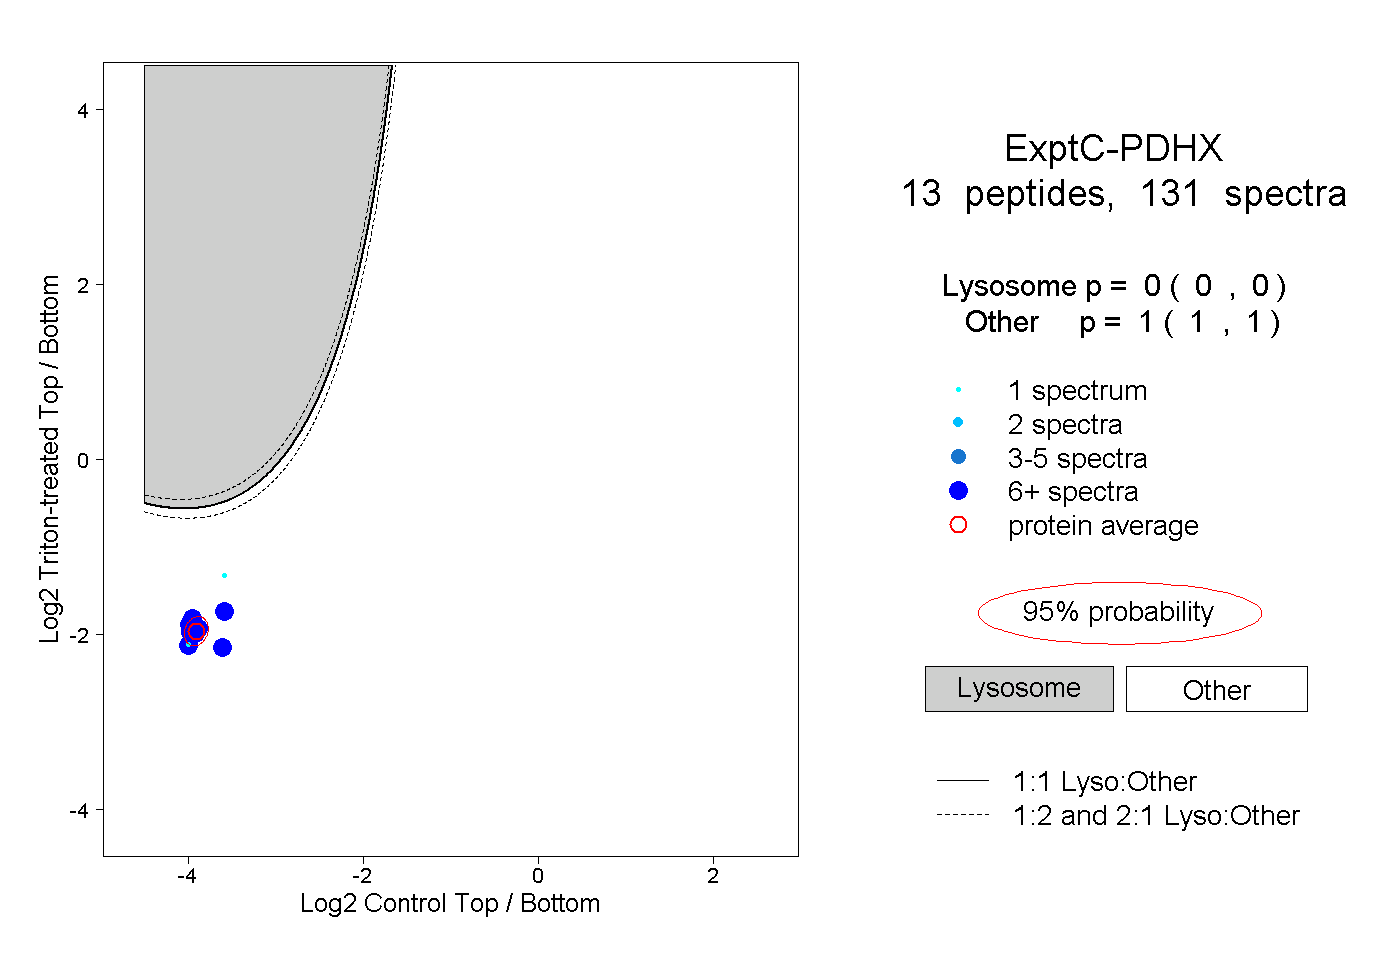 |
0.000 0.000 | 0.000 |
1.000 1.000 | 1.000 |
||||||||
| Plot | Lyso | Other | |||||||||||
| Expt D |
7 peptides |
30 spectra |
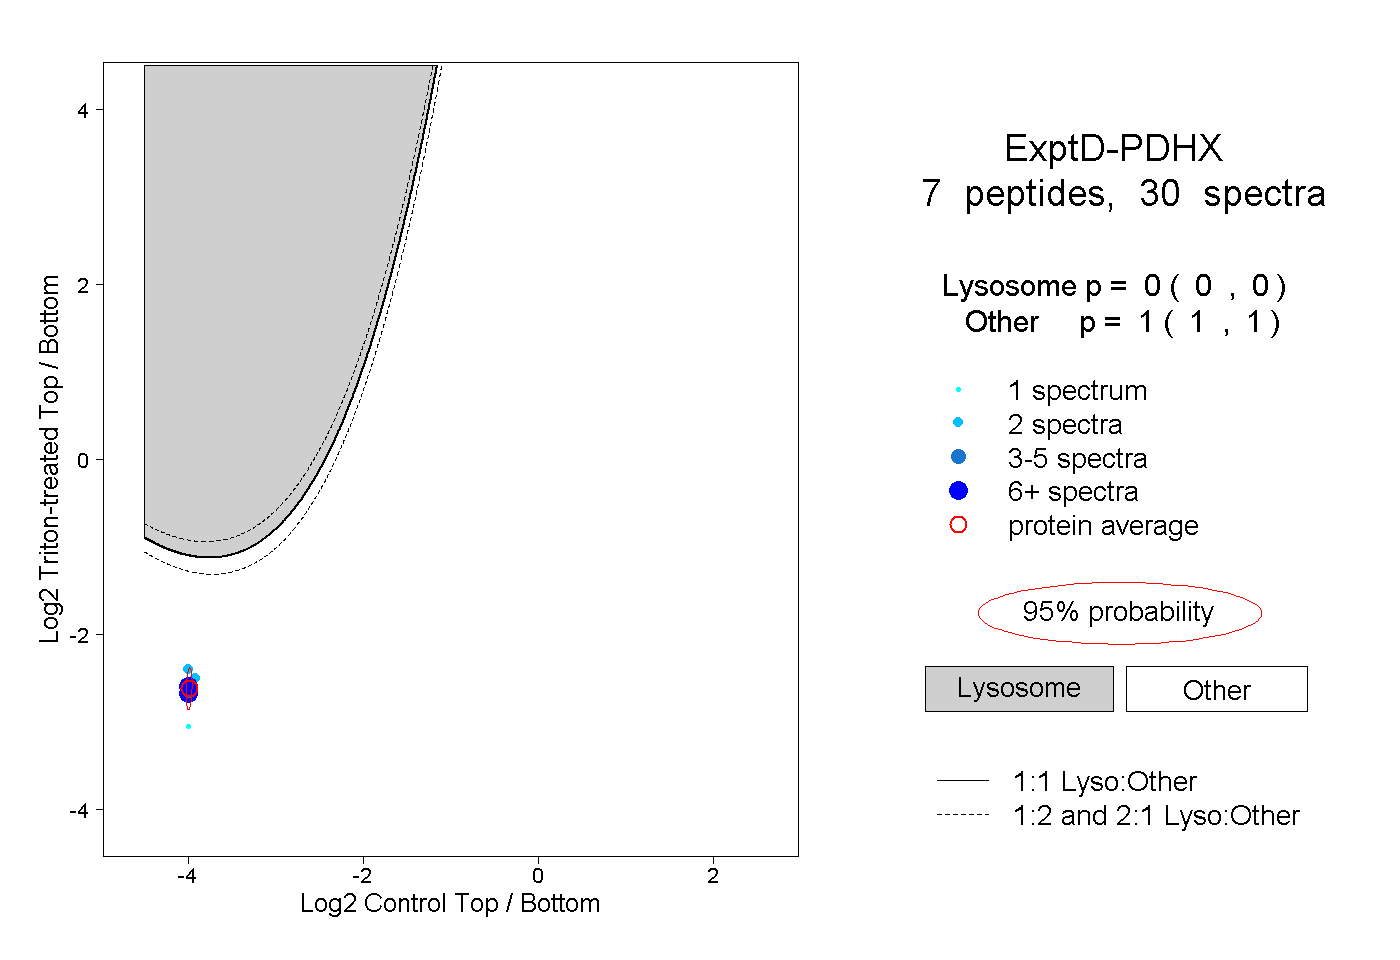 |
0.000 0.000 | 0.000 |
1.000 1.000 | 1.000 |