 7
7peptides
spectra
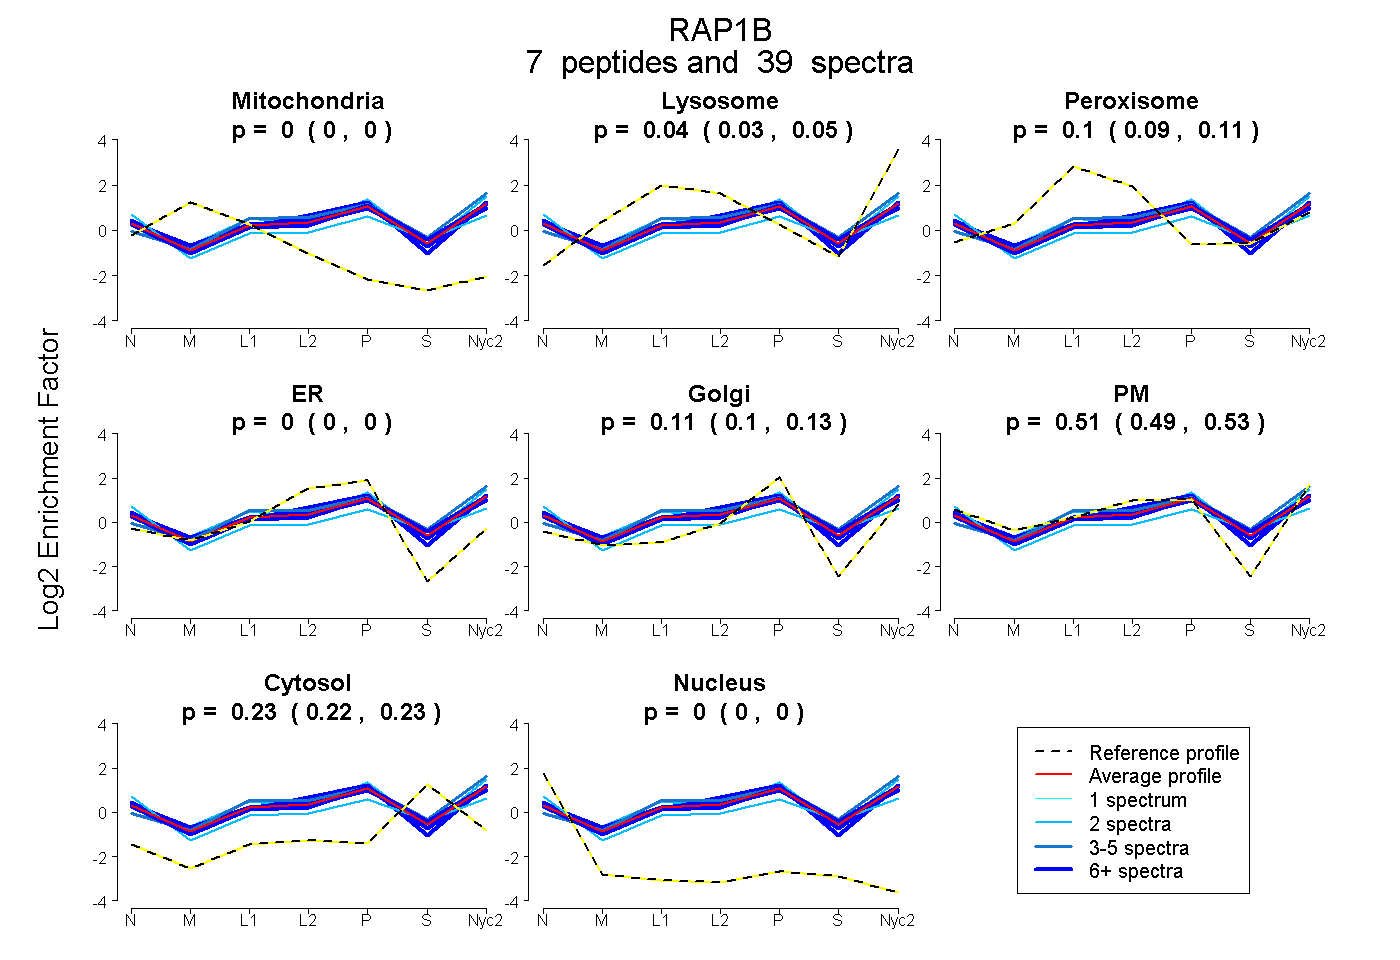
0.000 | 0.000
0.033 | 0.054
0.088 | 0.113
0.000 | 0.000
0.095 | 0.130
0.491 | 0.534
0.219 | 0.231
0.000 | 0.000
7peptides
spectra
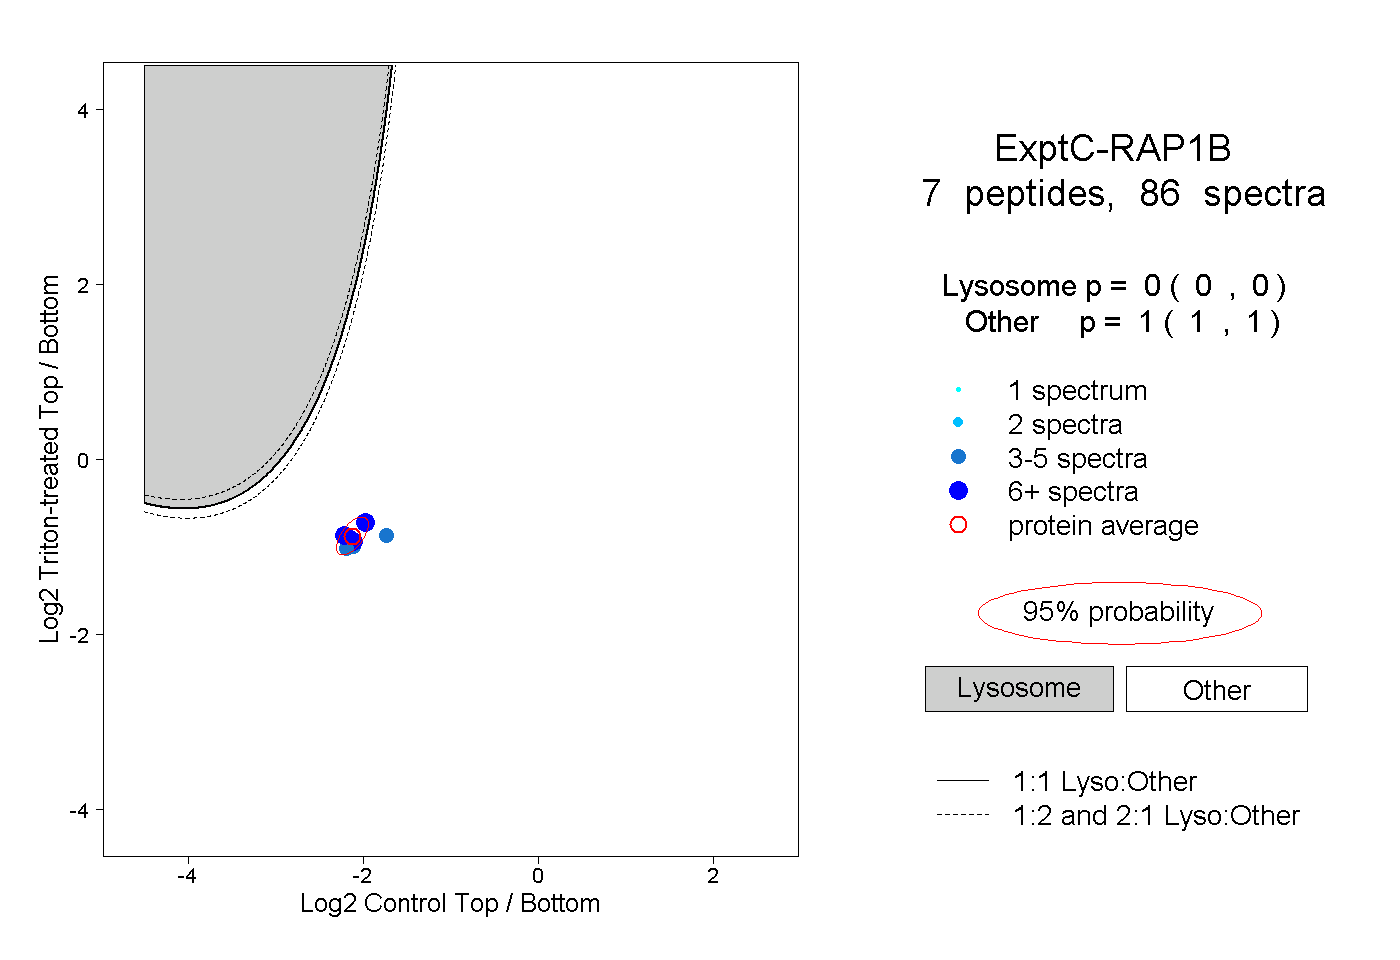
0.000 | 0.000
1.000 | 1.000
3peptides
spectra
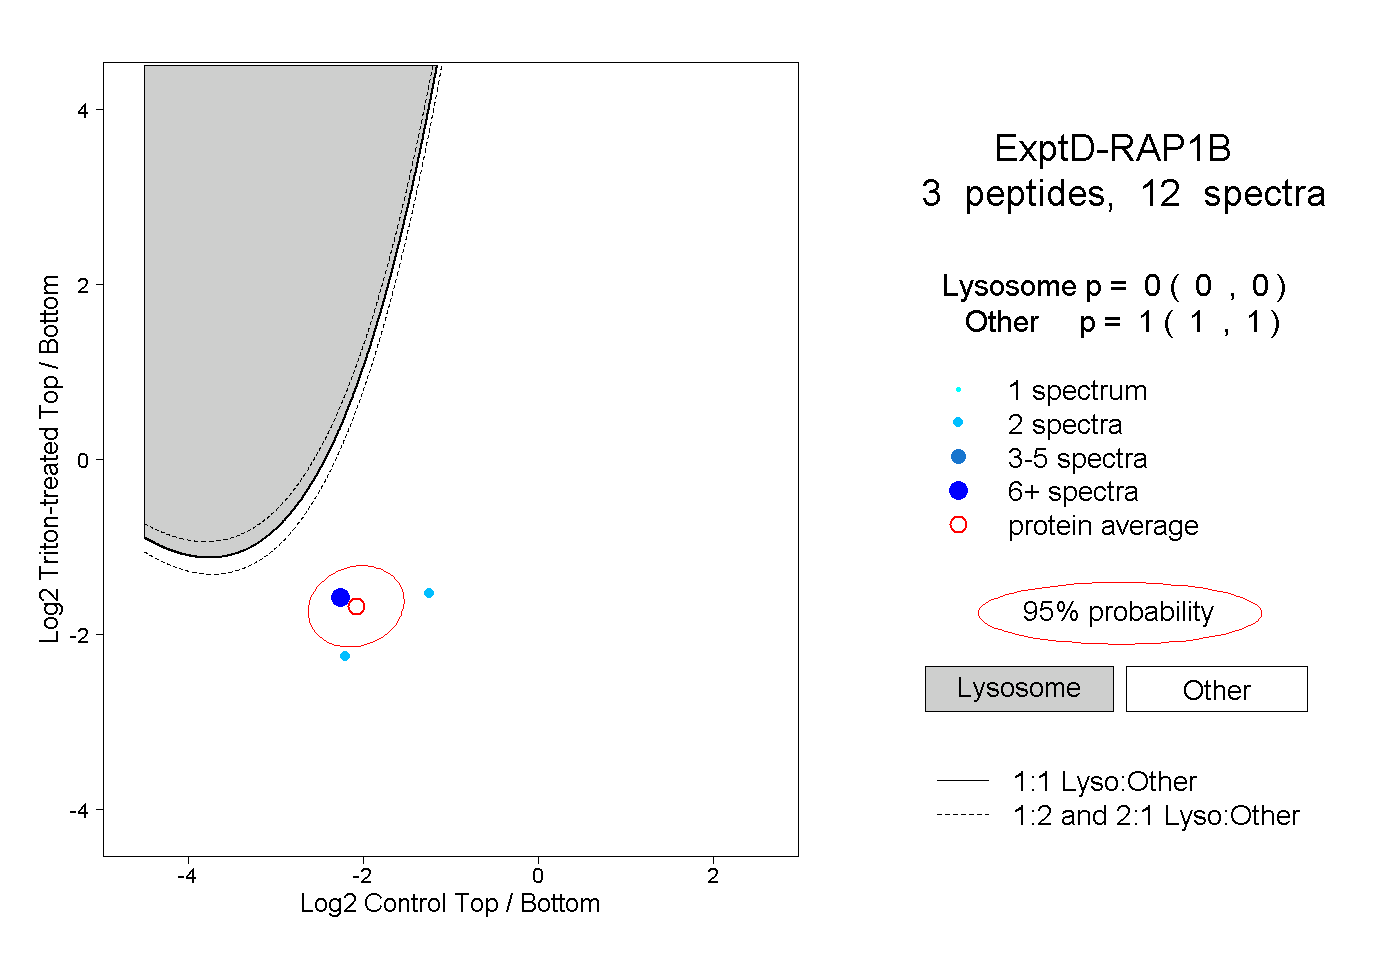
0.000 | 0.000
1.000 | 1.000