 7
7peptides
spectra
0.000 | 0.000
0.033 | 0.054
0.088 | 0.113
0.000 | 0.000
0.095 | 0.130
0.491 | 0.534
0.219 | 0.231
0.000 | 0.000
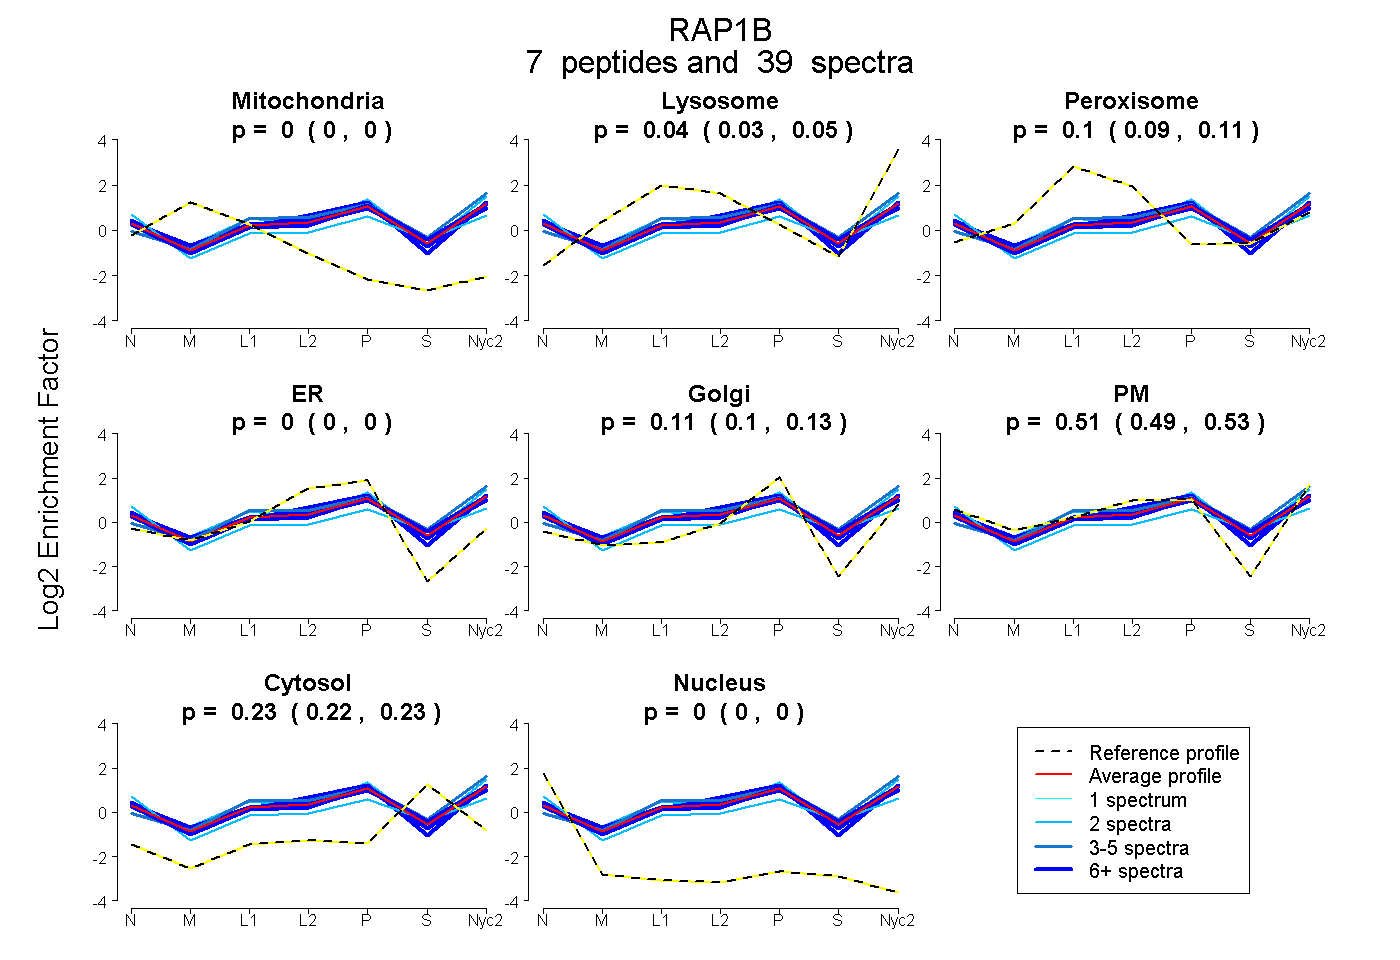
| Plot | Mito | Lyso | Perox | ER | Golgi | PM | Cytosol | Nucleus | |||||
| Expt A |
7 peptides |
39 spectra |
|
0.000 0.000 | 0.000 |
0.045 0.033 | 0.054 |
0.102 0.088 | 0.113 |
0.000 0.000 | 0.000 |
0.114 0.095 | 0.130 |
0.514 0.491 | 0.534 |
0.226 0.219 | 0.231 |
0.000 0.000 | 0.000 |
| 8 spectra, INVNEIFYDLVR | 0.000 | 0.014 | 0.131 | 0.000 | 0.110 | 0.553 | 0.192 | 0.000 | ||
| 2 spectra, TPVPGK | 0.000 | 0.000 | 0.006 | 0.000 | 0.000 | 0.620 | 0.375 | 0.000 | ||
| 3 spectra, SALTVQFVQGIFVEK | 0.000 | 0.247 | 0.077 | 0.000 | 0.144 | 0.326 | 0.206 | 0.000 | ||
| 2 spectra, DTDDVPMILVGNK | 0.000 | 0.197 | 0.113 | 0.000 | 0.328 | 0.219 | 0.143 | 0.000 | ||
| 9 spectra, EQGQNLAR | 0.000 | 0.000 | 0.087 | 0.000 | 0.119 | 0.640 | 0.155 | 0.000 | ||
| 6 spectra, LVVLGSGGVGK | 0.000 | 0.000 | 0.125 | 0.000 | 0.095 | 0.513 | 0.267 | 0.000 | ||
| 9 spectra, YDPTIEDSYR | 0.000 | 0.059 | 0.075 | 0.000 | 0.133 | 0.473 | 0.260 | 0.000 |
| Plot | Lyso | Other | |||||||||||
| Expt C |
7 peptides |
86 spectra |
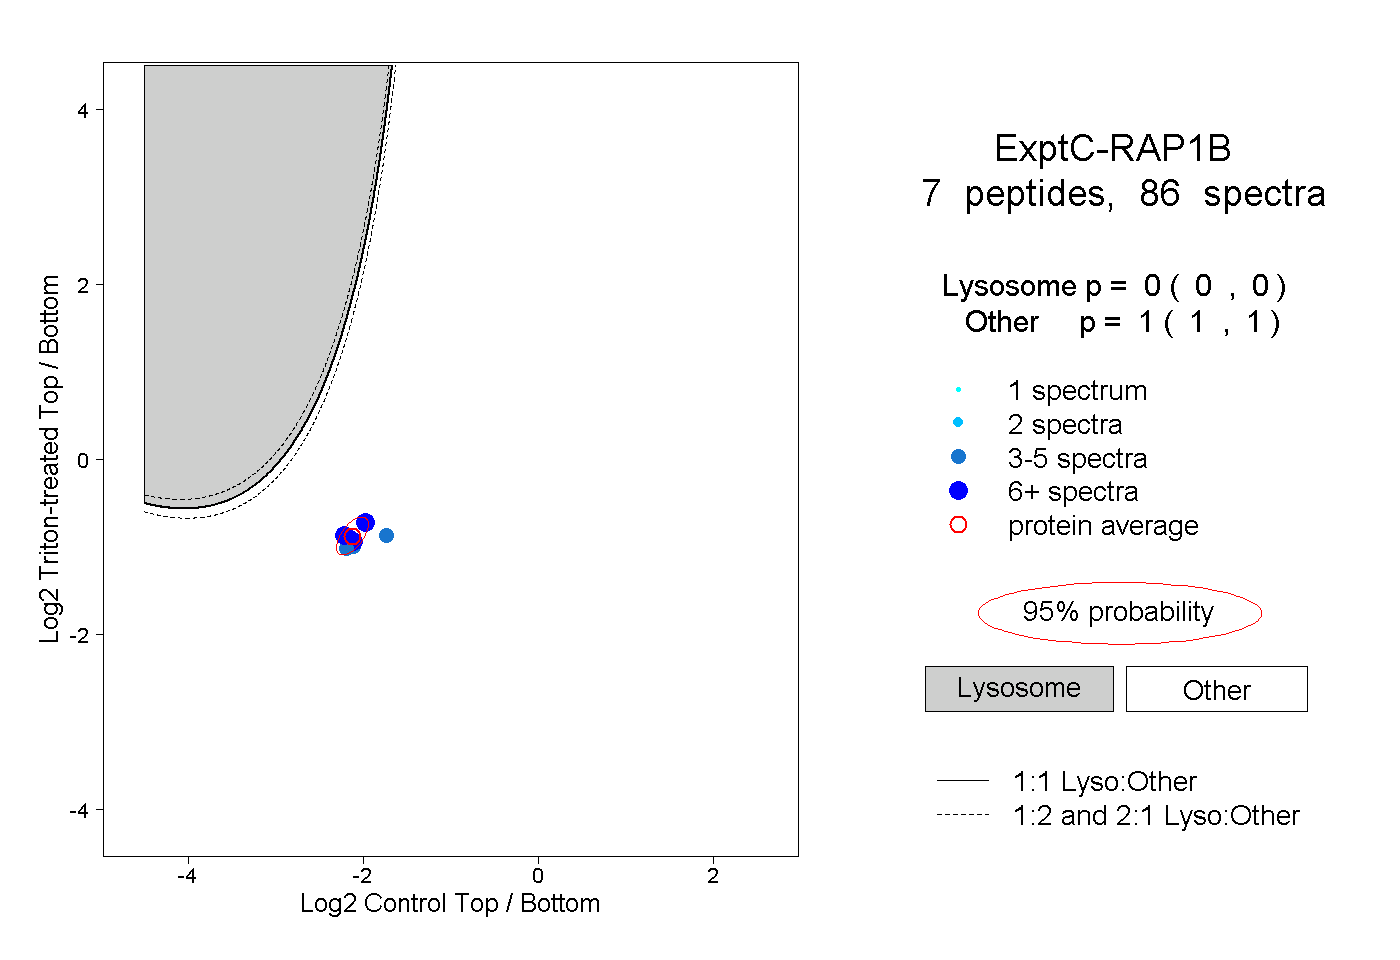 |
0.000 0.000 | 0.000 |
1.000 1.000 | 1.000 |
||||||||
| Plot | Lyso | Other | |||||||||||
| Expt D |
3 peptides |
12 spectra |
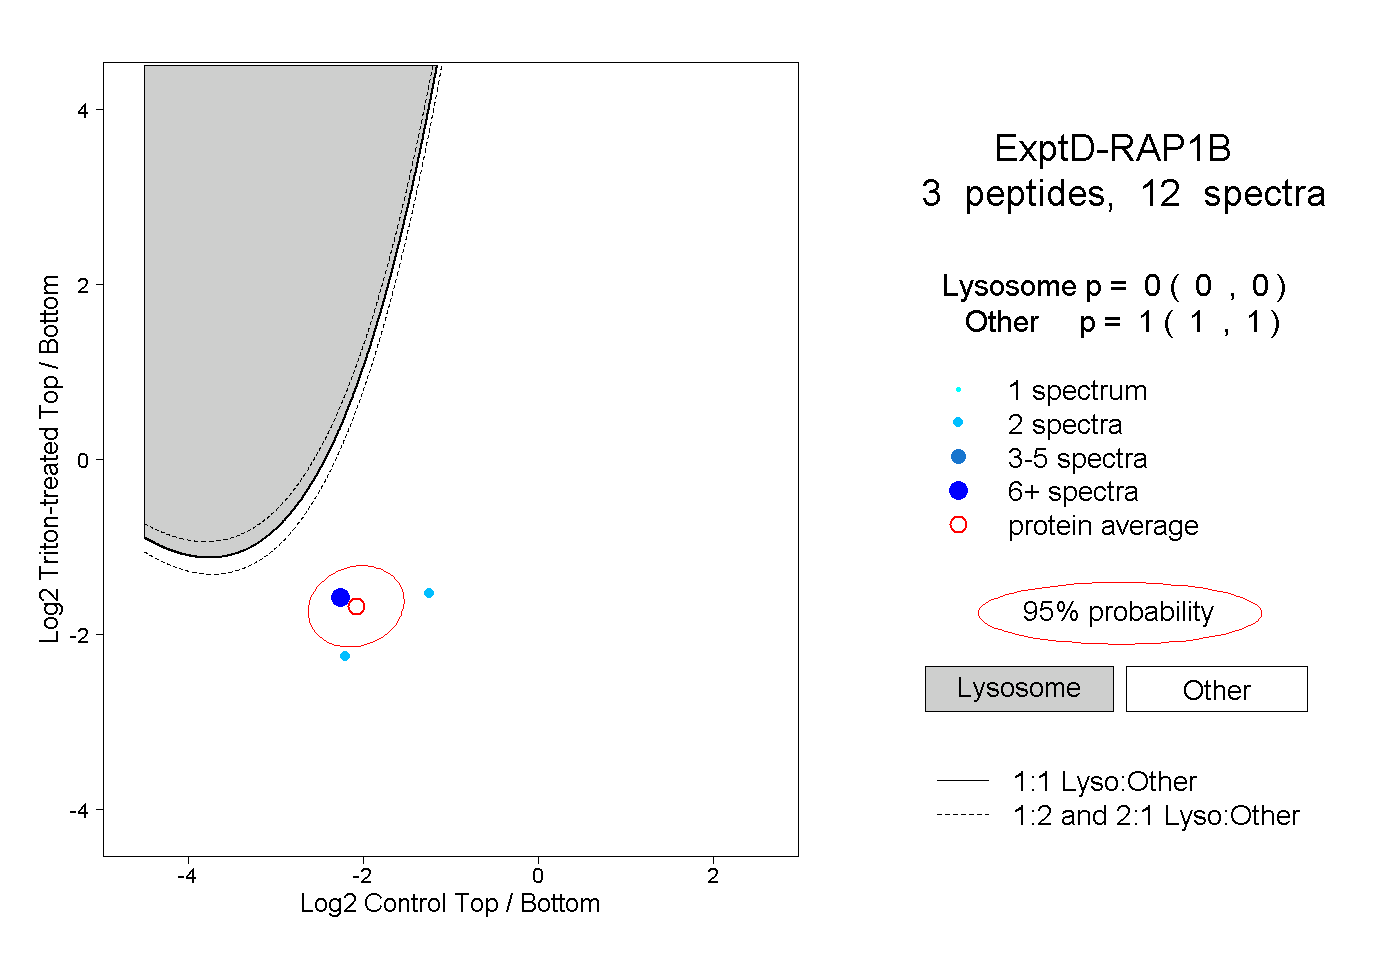 |
0.000 0.000 | 0.000 |
1.000 1.000 | 1.000 |