 2
2peptides
spectra
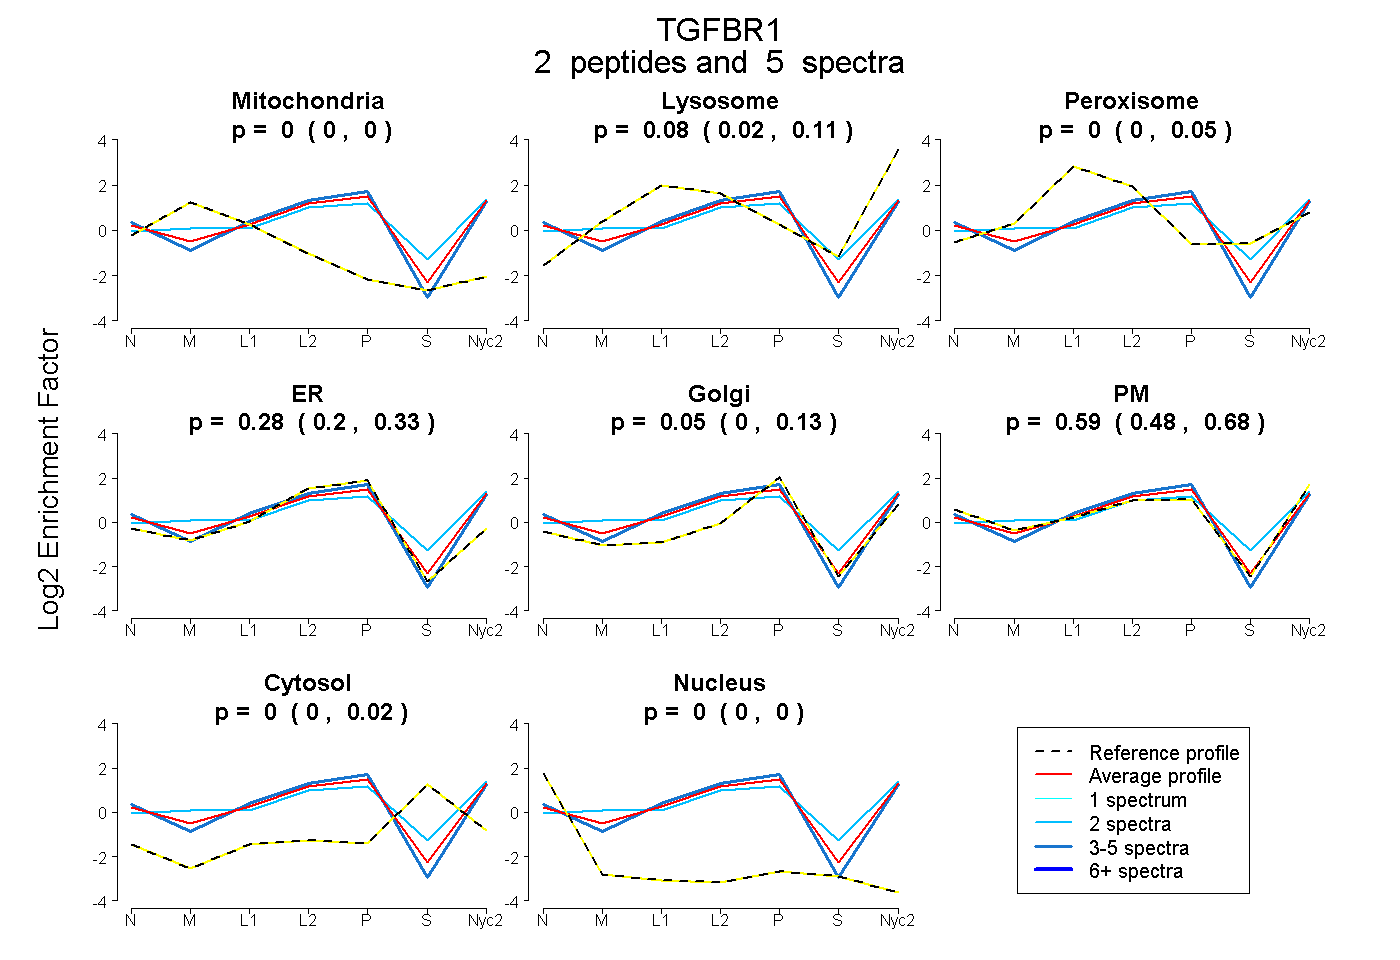
0.000 | 0.000
0.021 | 0.109
0.000 | 0.048
0.196 | 0.327
0.000 | 0.125
0.481 | 0.682
0.000 | 0.018
0.000 | 0.000
3peptides
spectra
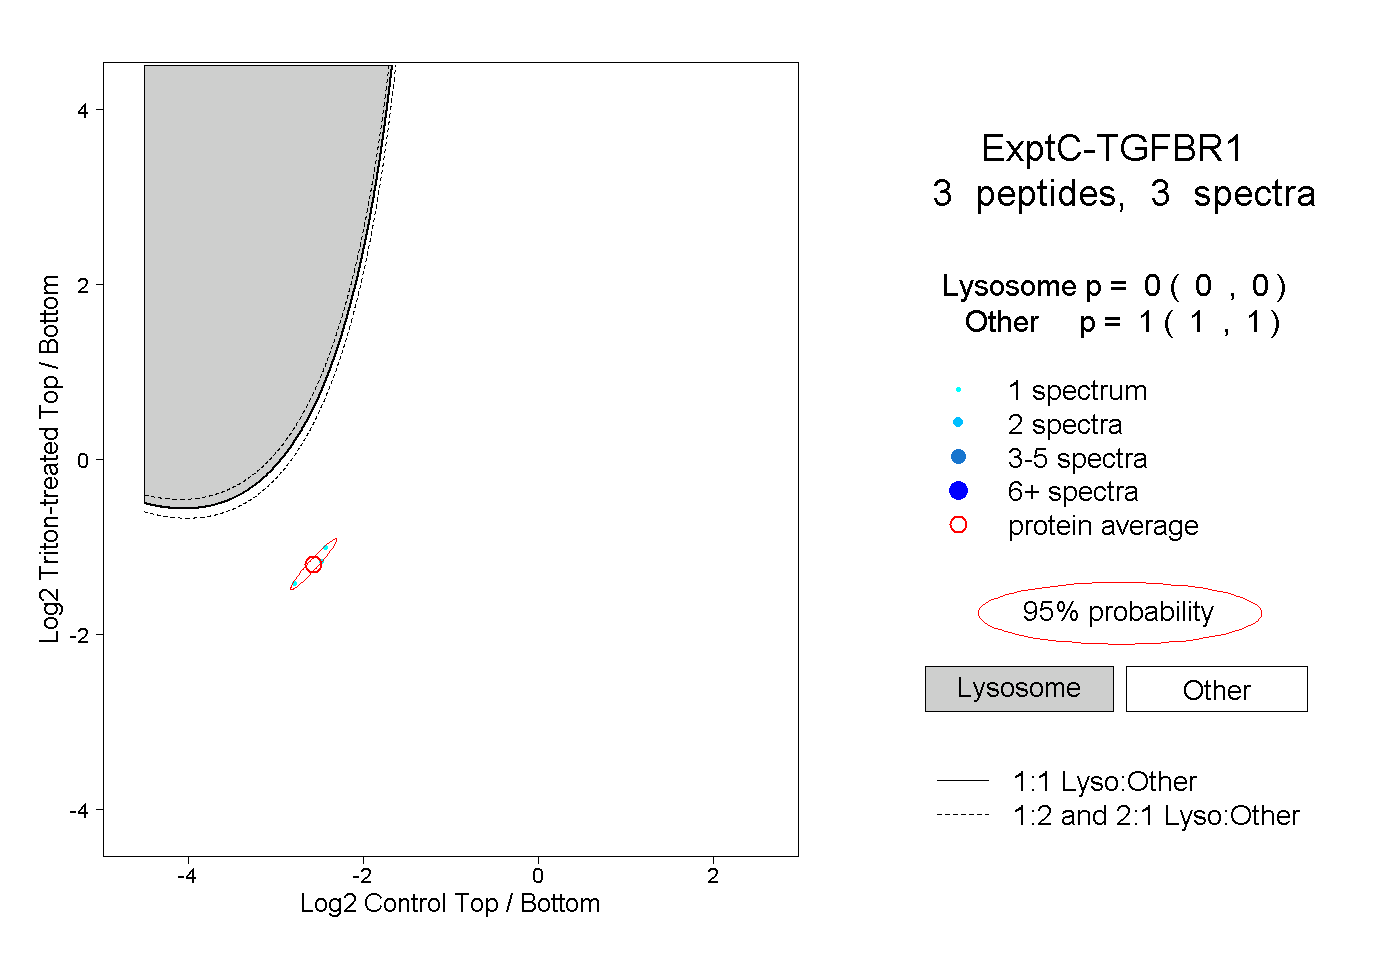
0.000 | 0.000
1.000 | 1.000
1peptide
spectrum
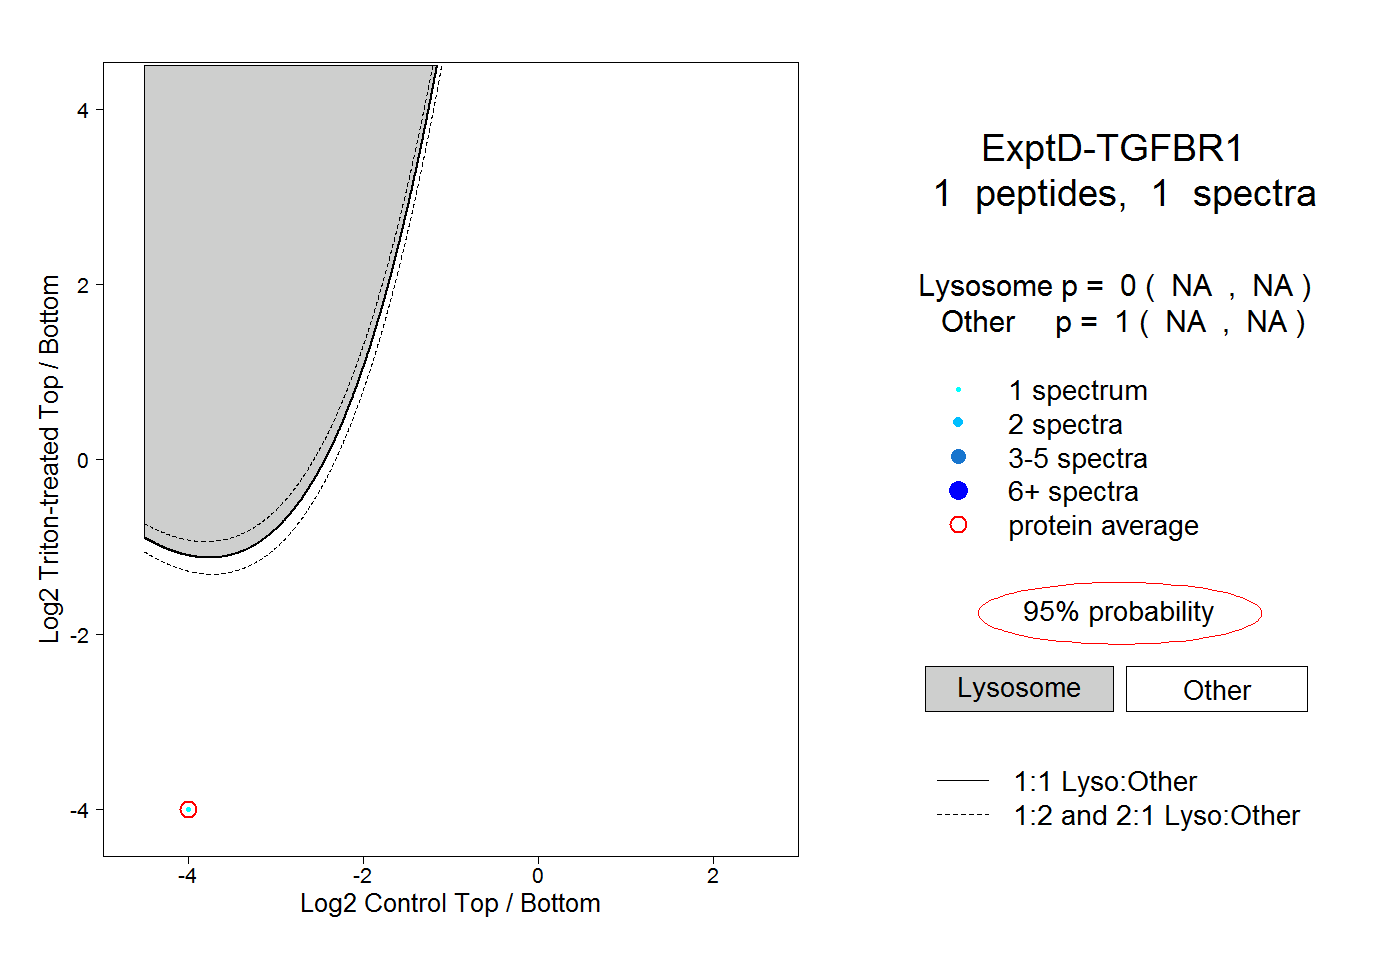
NA | NA
NA | NA