 2
2peptides
spectra
0.000 | 0.000
0.021 | 0.109
0.000 | 0.048
0.196 | 0.327
0.000 | 0.125
0.481 | 0.682
0.000 | 0.018
0.000 | 0.000
| Plot | Mito | Lyso | Perox | ER | Golgi | PM | Cytosol | Nucleus | |||||
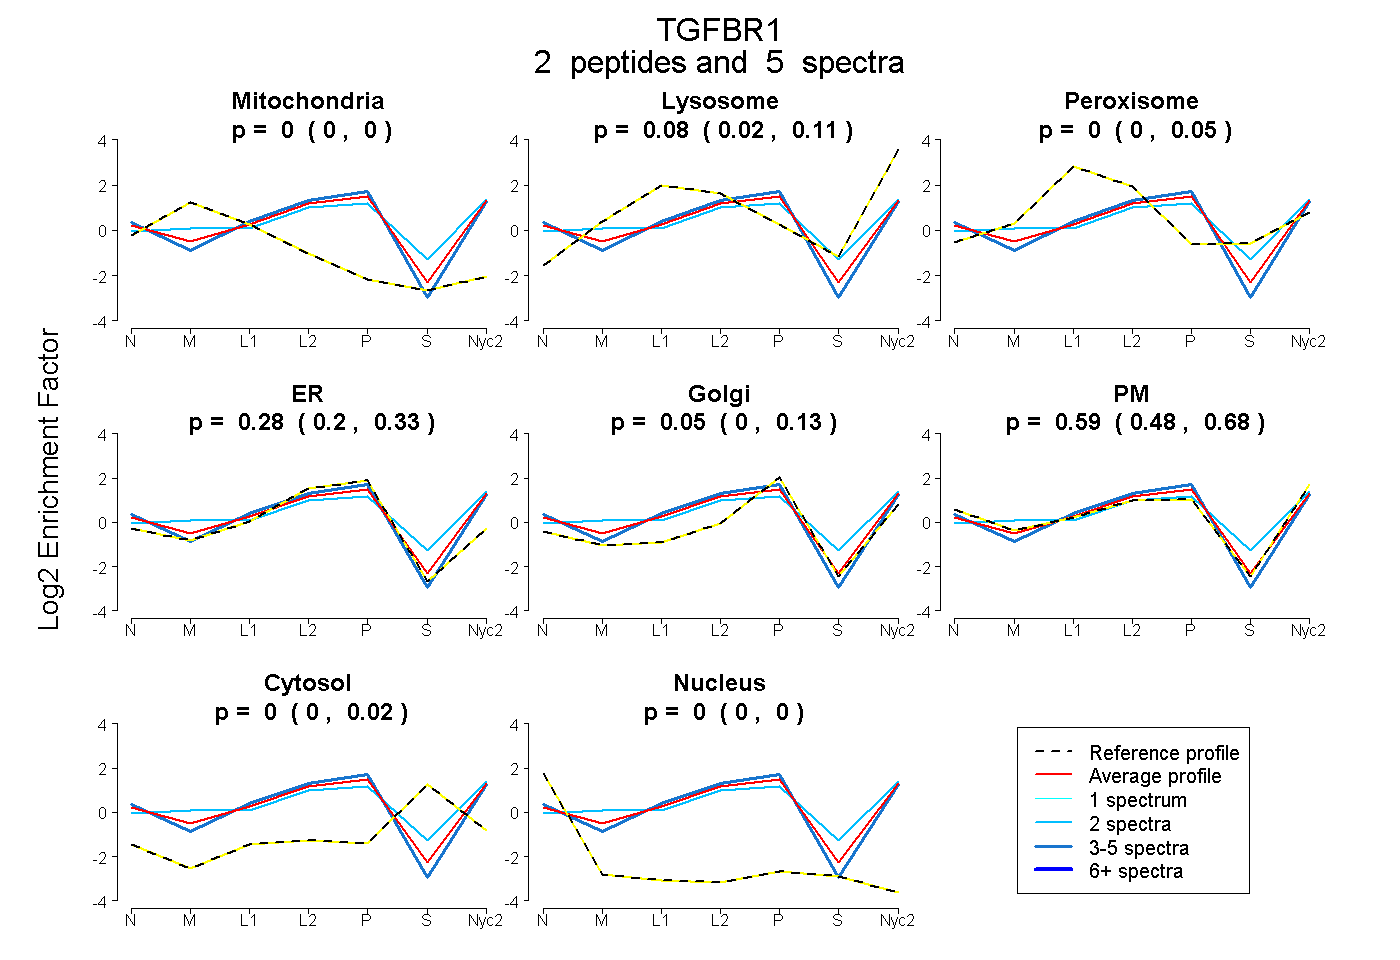
| Expt A |
2 peptides |
5 spectra |
|
0.000 0.000 | 0.000 |
0.077 0.021 | 0.109 |
0.000 0.000 | 0.048 |
0.279 0.196 | 0.327 |
0.055 0.000 | 0.125 |
0.590 0.481 | 0.682 |
0.000 0.000 | 0.018 |
0.000 0.000 | 0.000 |
| 3 spectra, LRPNIPNR | 0.000 | 0.000 | 0.000 | 0.354 | 0.000 | 0.646 | 0.000 | 0.000 | ||
| 2 spectra, FGEVWR | 0.000 | 0.117 | 0.157 | 0.000 | 0.281 | 0.400 | 0.045 | 0.000 |
| Plot | Lyso | Other | |||||||||||
| Expt C |
3 peptides |
3 spectra |
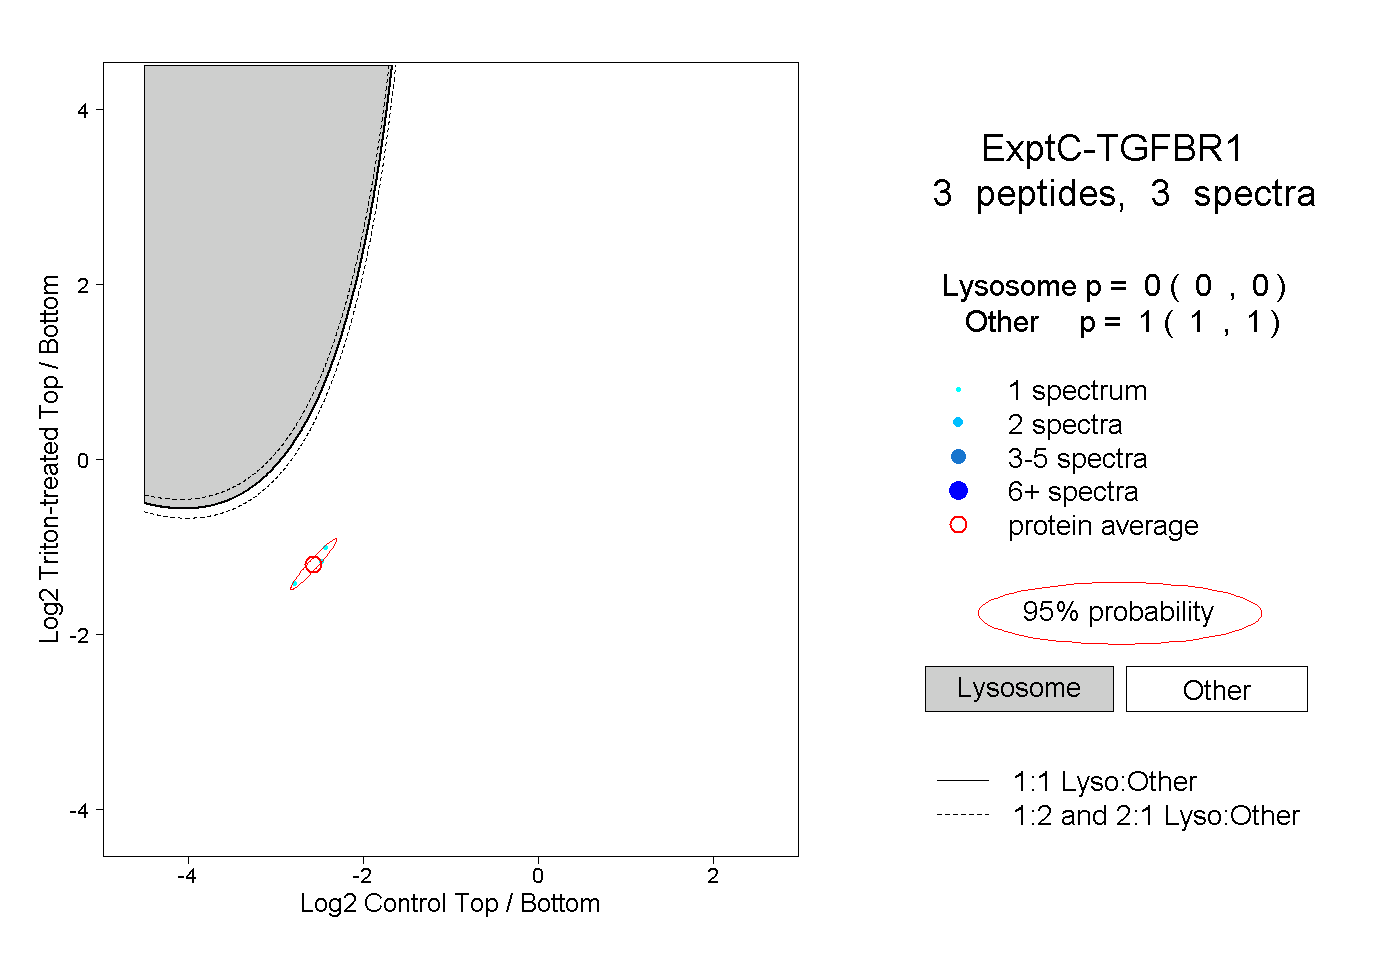 |
0.000 0.000 | 0.000 |
1.000 1.000 | 1.000 |
||||||||
| Plot | Lyso | Other | |||||||||||
| Expt D |
1 peptide |
1 spectrum |
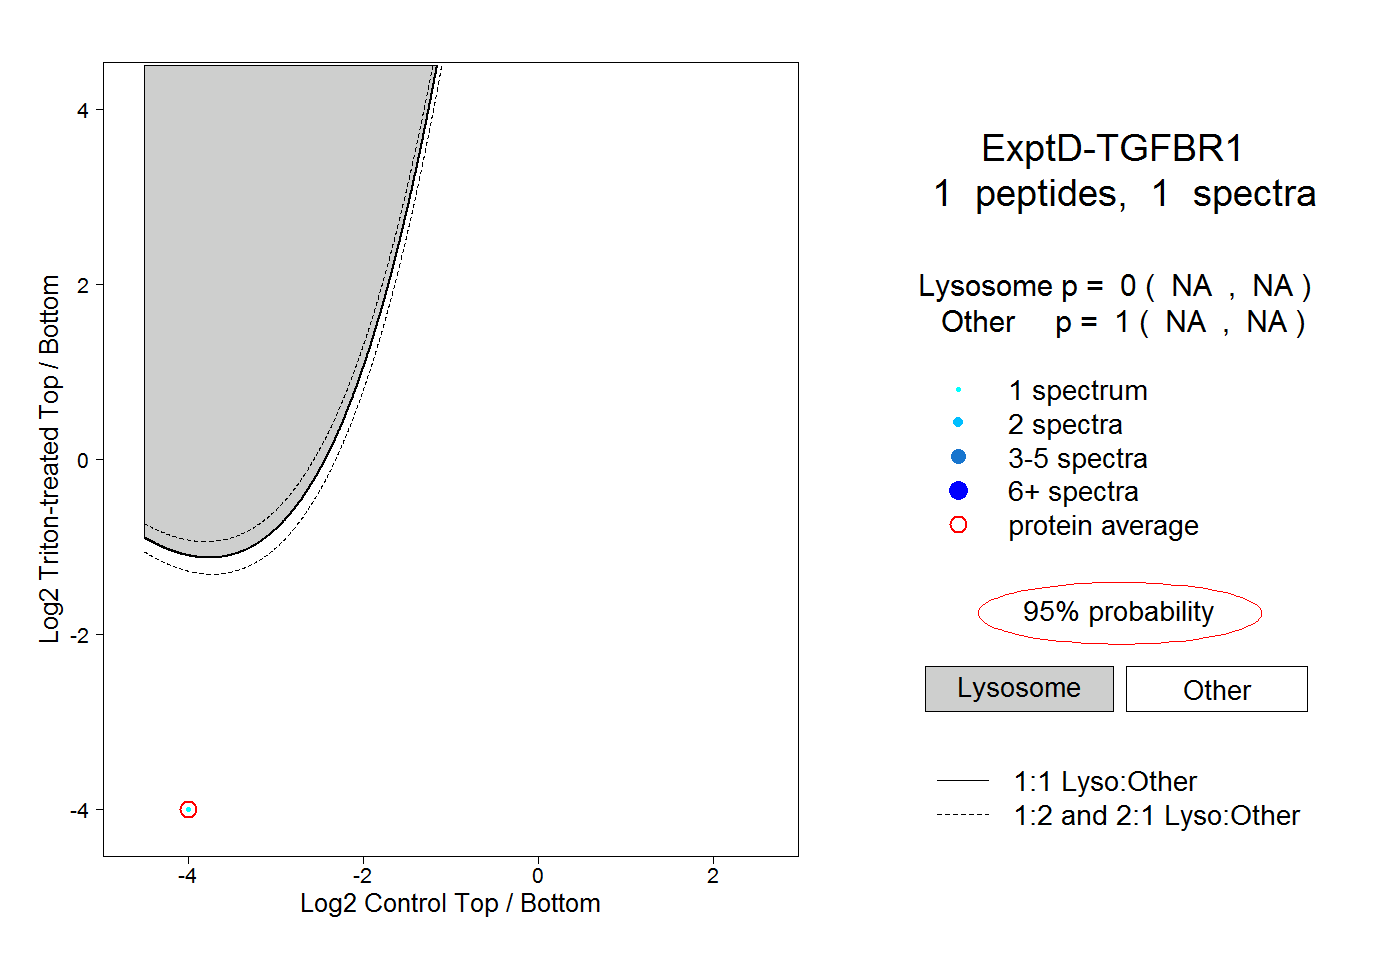 |
0.000 NA | NA |
1.000 NA | NA |