 13
13peptides
spectra
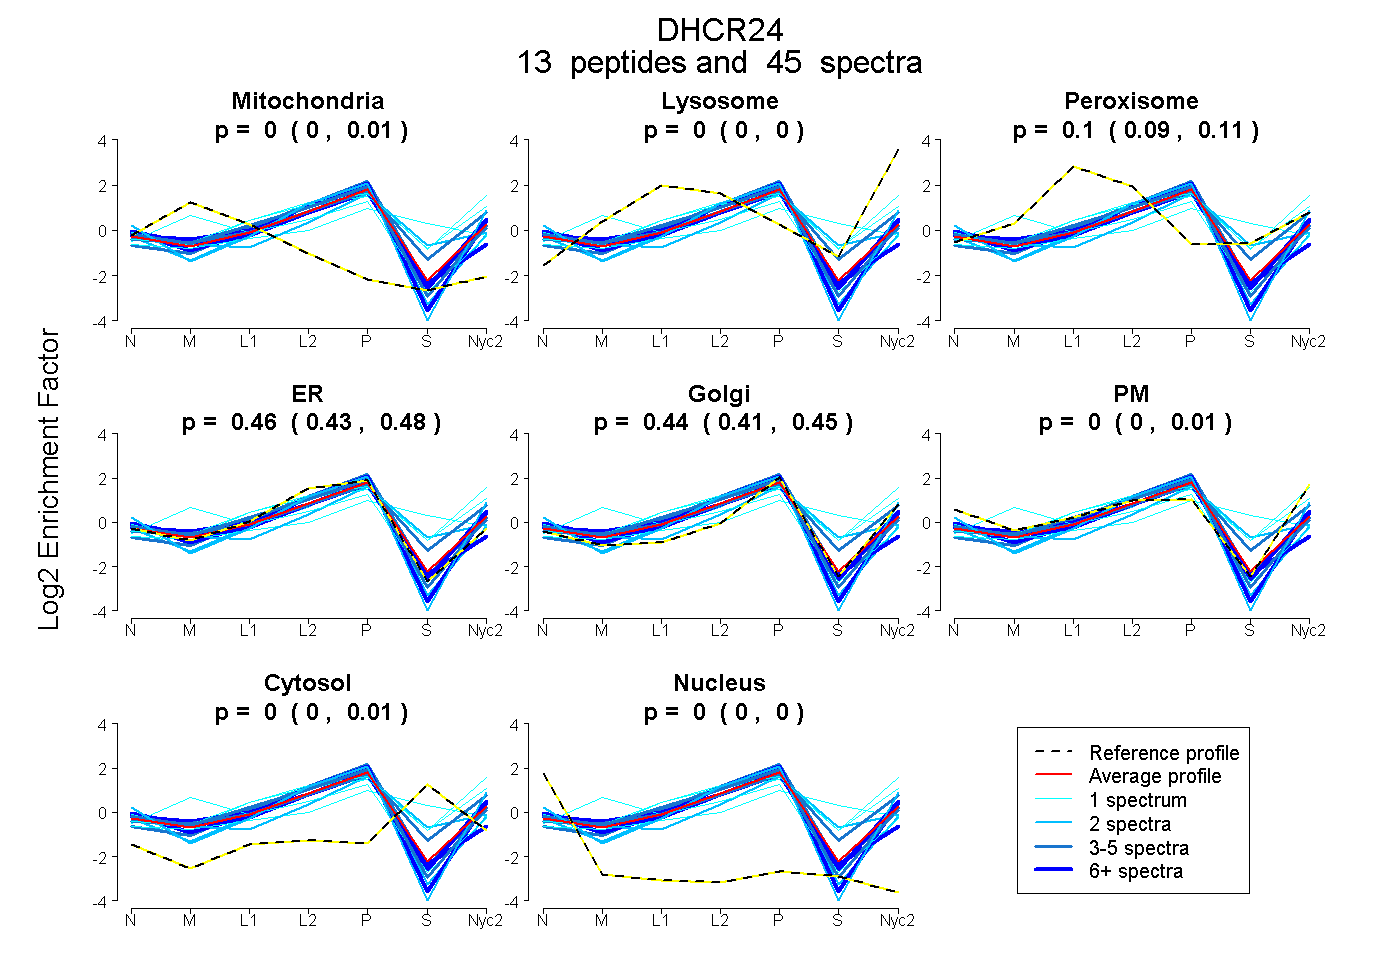
0.000 | 0.005
0.000 | 0.000
0.089 | 0.113
0.431 | 0.476
0.413 | 0.451
0.000 | 0.011
0.000 | 0.011
0.000 | 0.000
9peptides
spectra
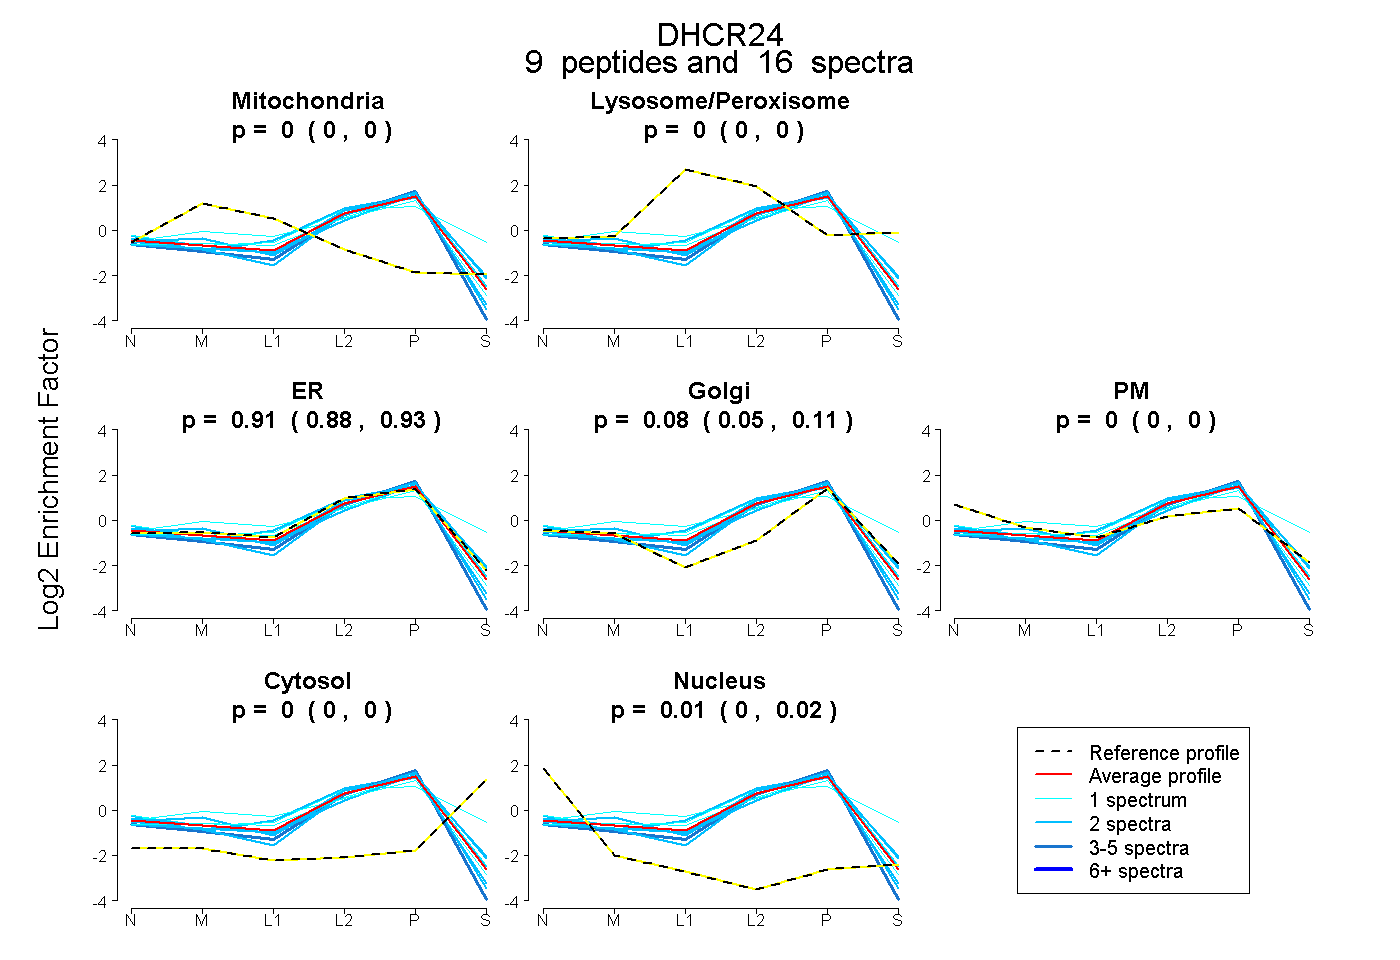
0.000 | 0.000
0.000 | 0.000
0.881 | 0.929
0.049 | 0.110
0.000 | 0.000
0.000 | 0.000
0.003 | 0.018
11peptides
spectra
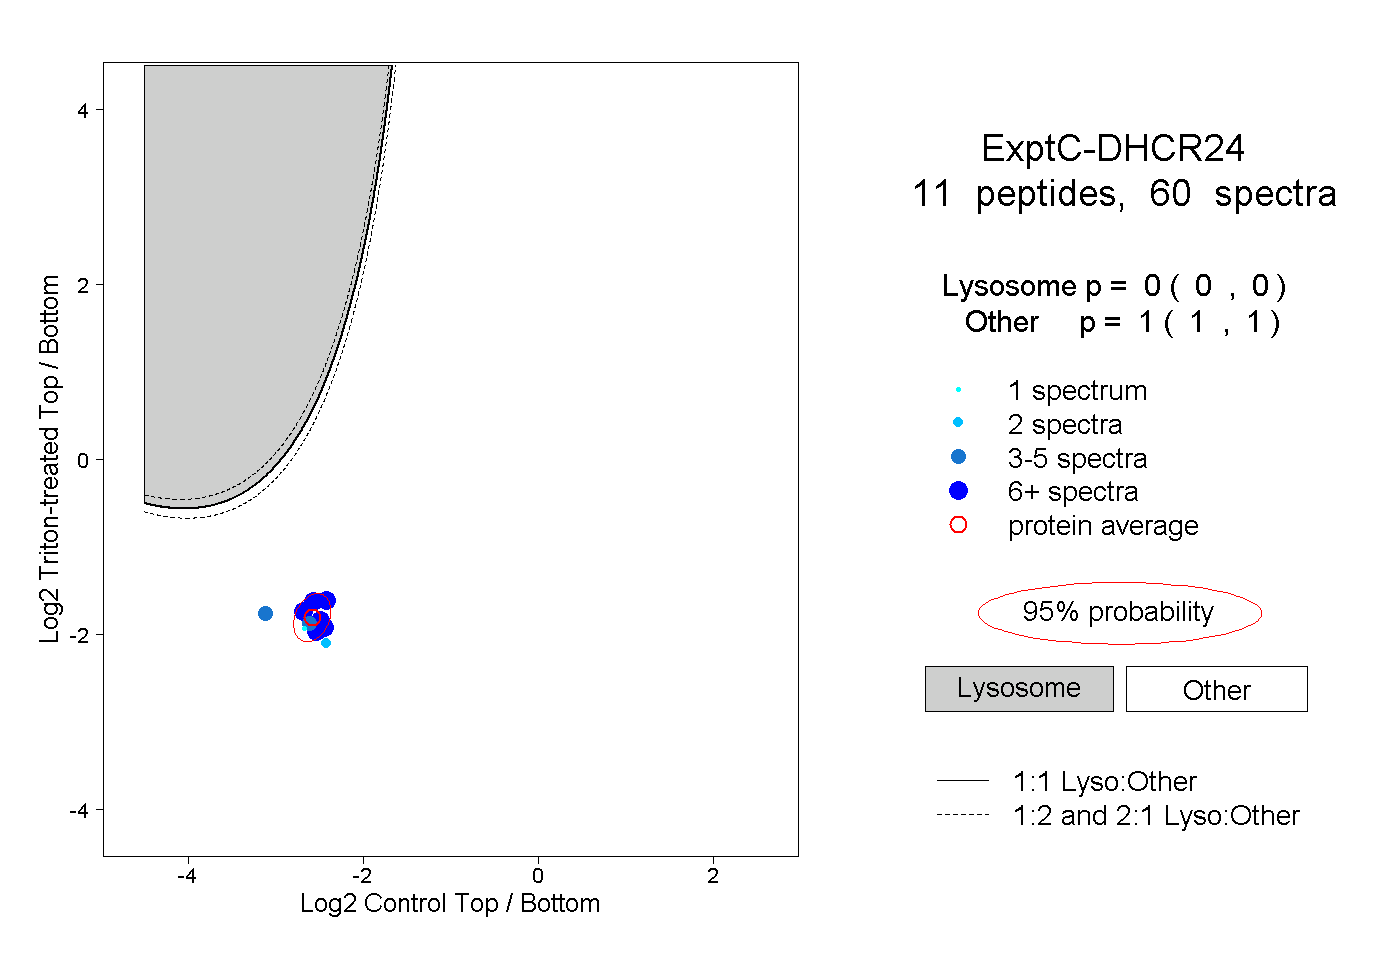
0.000 | 0.000
1.000 | 1.000
4peptides
spectra
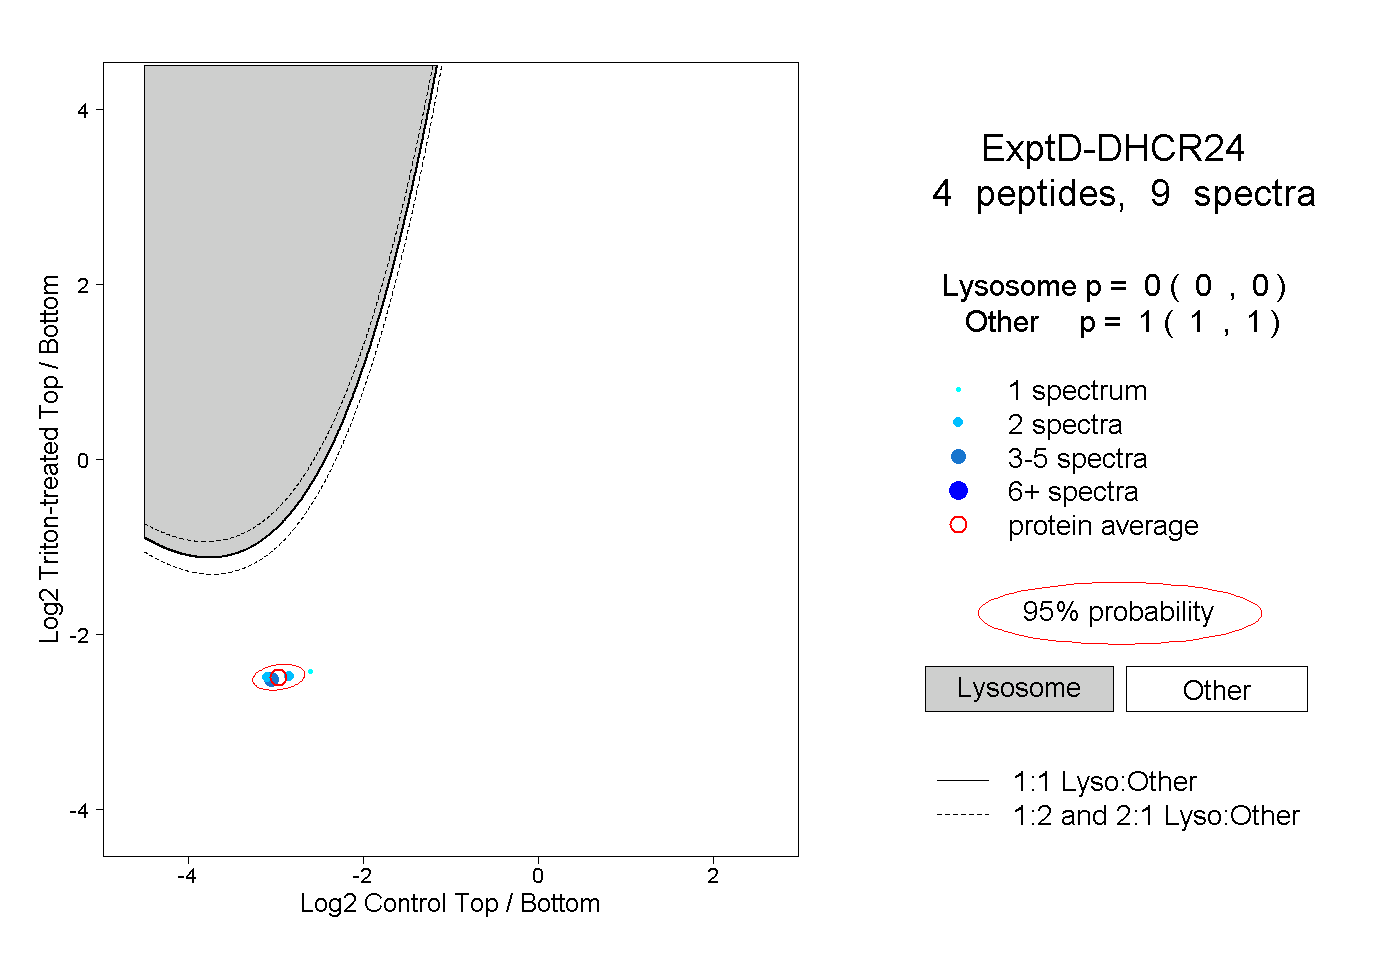
0.000 | 0.000
1.000 | 1.000