 13
13peptides
spectra
0.000 | 0.005
0.000 | 0.000
0.089 | 0.113
0.431 | 0.476
0.413 | 0.451
0.000 | 0.011
0.000 | 0.011
0.000 | 0.000
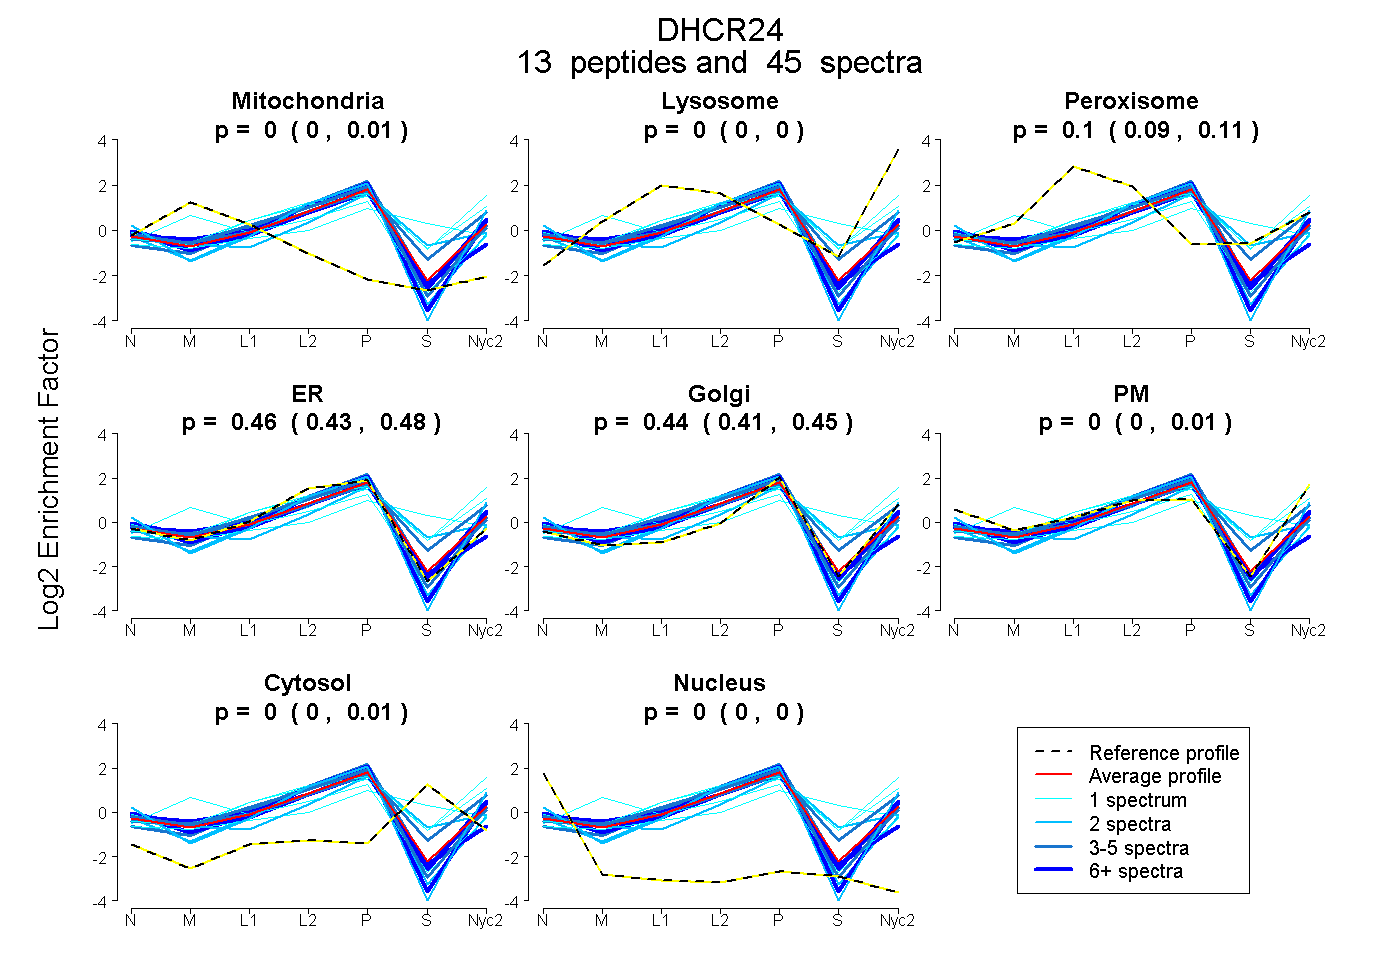
| Plot | Mito | Lyso | Perox | ER | Golgi | PM | Cytosol | Nucleus | |||||
| Expt A |
13 peptides |
45 spectra |
|
0.000 0.000 | 0.005 |
0.000 0.000 | 0.000 |
0.105 0.089 | 0.113 |
0.456 0.431 | 0.476 |
0.438 0.413 | 0.451 |
0.000 0.000 | 0.011 |
0.002 0.000 | 0.011 |
0.000 0.000 | 0.000 |
| 4 spectra, EEFWEMFDGSLYHK | 0.000 | 0.038 | 0.000 | 0.737 | 0.220 | 0.000 | 0.005 | 0.000 | ||
| 4 spectra, VQDIQK | 0.009 | 0.000 | 0.000 | 0.693 | 0.129 | 0.169 | 0.000 | 0.000 | ||
| 7 spectra, HVENYLK | 0.017 | 0.000 | 0.000 | 0.426 | 0.338 | 0.219 | 0.000 | 0.000 | ||
| 8 spectra, EGLEYIPLR | 0.000 | 0.000 | 0.000 | 0.626 | 0.234 | 0.140 | 0.000 | 0.000 | ||
| 2 spectra, GLEFVLIHQR | 0.000 | 0.000 | 0.057 | 0.306 | 0.393 | 0.000 | 0.244 | 0.000 | ||
| 1 spectrum, NIMINLMDILEVDTK | 0.000 | 0.353 | 0.039 | 0.235 | 0.239 | 0.056 | 0.078 | 0.000 | ||
| 9 spectra, GLEAICEK | 0.128 | 0.000 | 0.000 | 0.741 | 0.119 | 0.000 | 0.012 | 0.000 | ||
| 1 spectrum, FTHESQR | 0.000 | 0.000 | 0.195 | 0.111 | 0.294 | 0.000 | 0.400 | 0.000 | ||
| 2 spectra, YLFGWMVPPK | 0.000 | 0.000 | 0.000 | 0.479 | 0.262 | 0.259 | 0.000 | 0.000 | ||
| 1 spectrum, LTQGETLR | 0.260 | 0.057 | 0.000 | 0.469 | 0.213 | 0.000 | 0.000 | 0.000 | ||
| 2 spectra, AWVVFK | 0.000 | 0.000 | 0.000 | 0.664 | 0.307 | 0.000 | 0.000 | 0.029 | ||
| 3 spectra, LYEQHHVVQDMLVPMK | 0.000 | 0.106 | 0.128 | 0.215 | 0.490 | 0.000 | 0.060 | 0.000 | ||
| 1 spectrum, LSSAPR | 0.000 | 0.127 | 0.187 | 0.190 | 0.249 | 0.156 | 0.092 | 0.000 |
| Plot | Mito | Lyso or Perox | ER | Golgi | PM | Cytosol | Nucleus | ||||||
| Expt B |
9 peptides |
16 spectra |
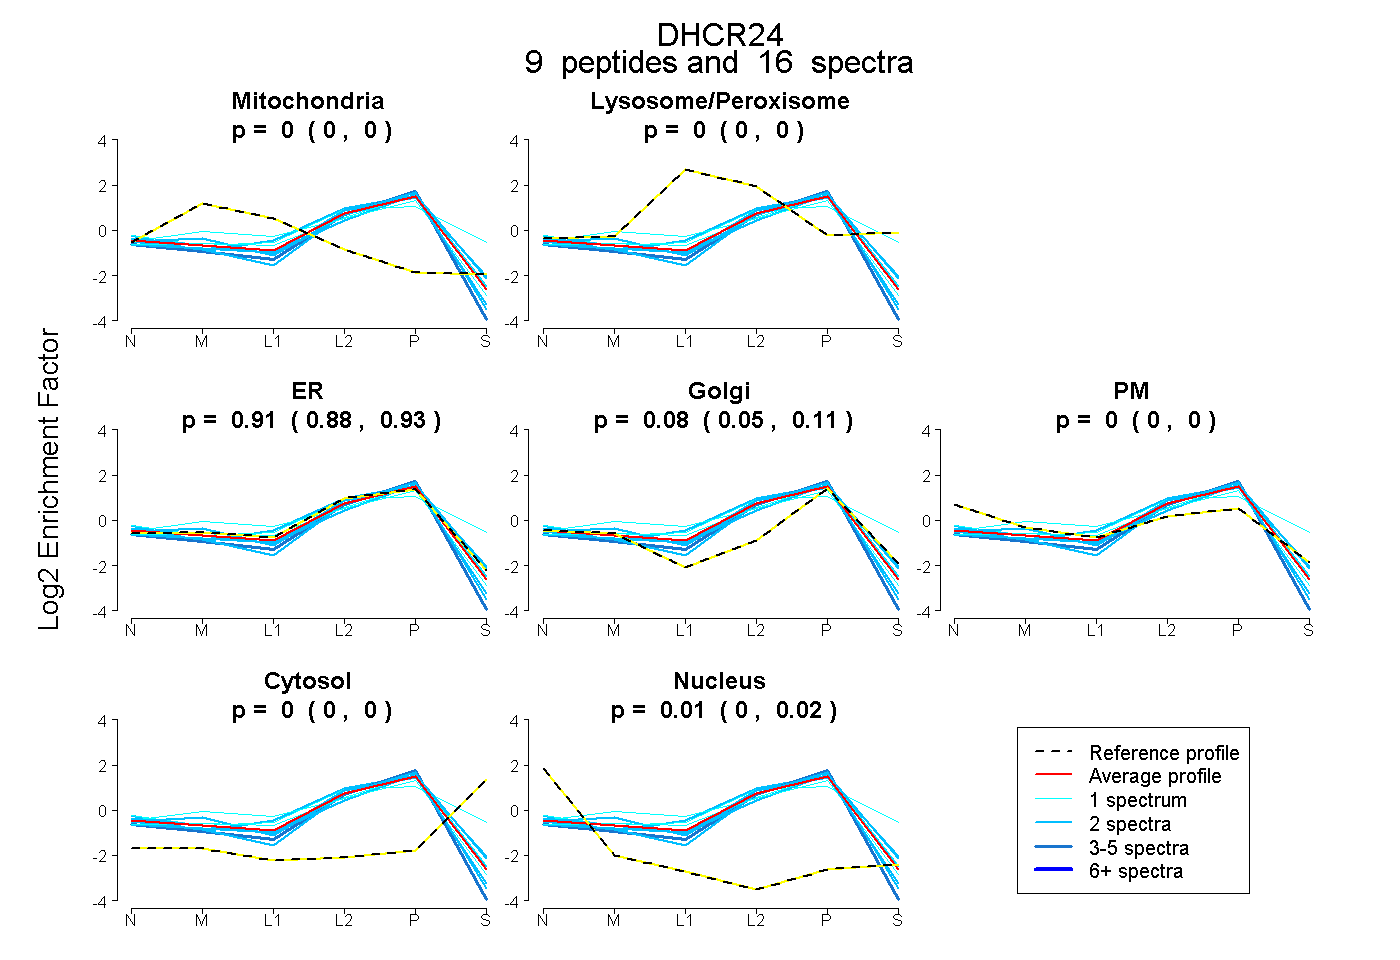 |
0.000 0.000 | 0.000 |
0.000 0.000 | 0.000 |
0.907 0.881 | 0.929 |
0.083 0.049 | 0.110 |
0.000 0.000 | 0.000 |
0.000 0.000 | 0.000 |
0.011 0.003 | 0.018 |
|||
| Plot | Lyso | Other | |||||||||||
| Expt C |
11 peptides |
60 spectra |
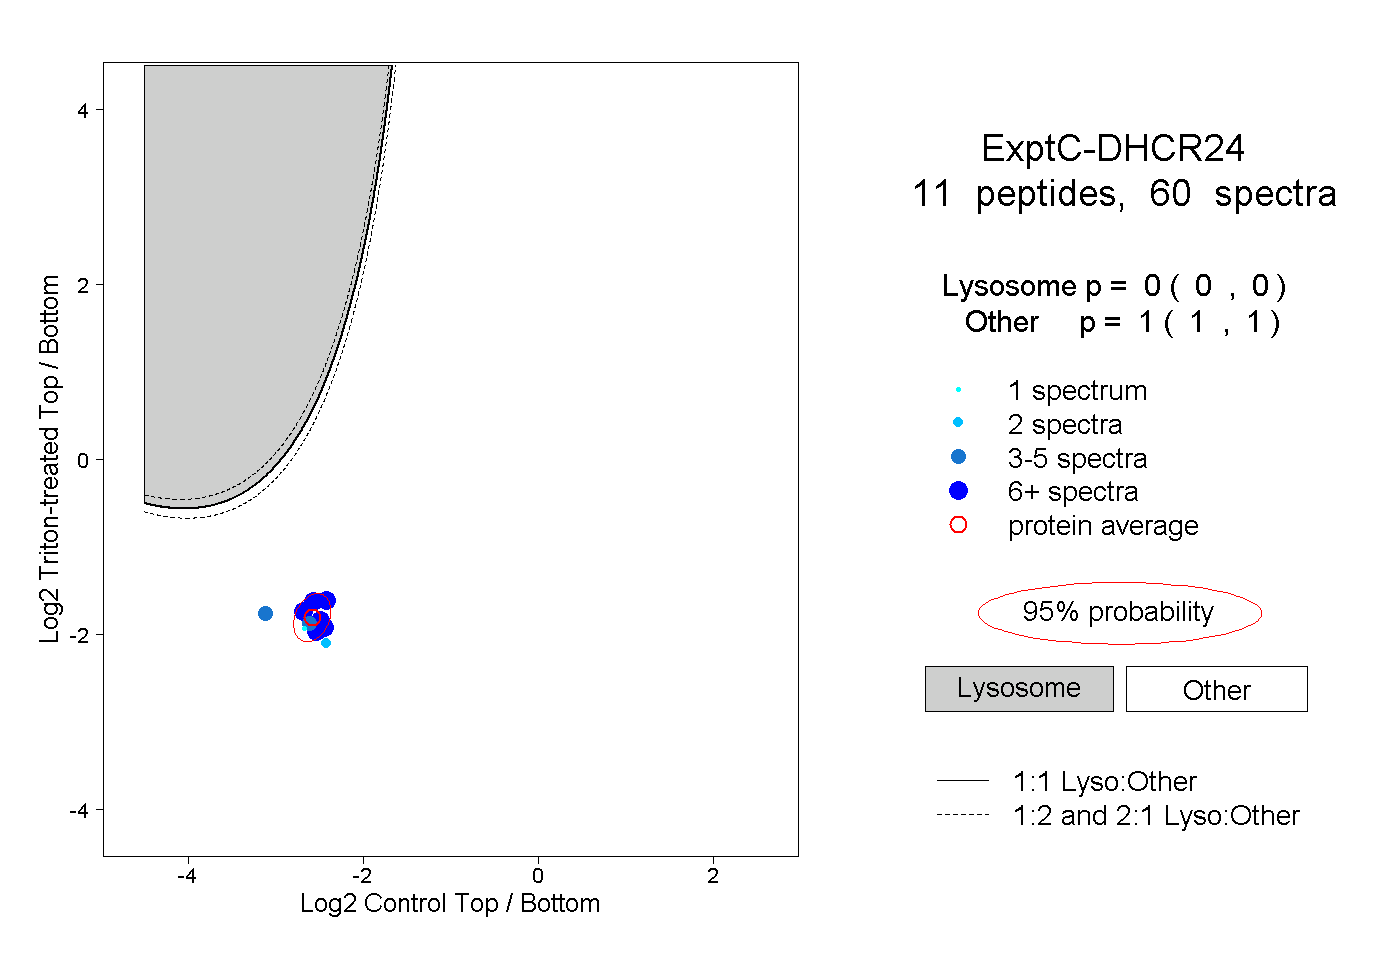 |
0.000 0.000 | 0.000 |
1.000 1.000 | 1.000 |
||||||||
| Plot | Lyso | Other | |||||||||||
| Expt D |
4 peptides |
9 spectra |
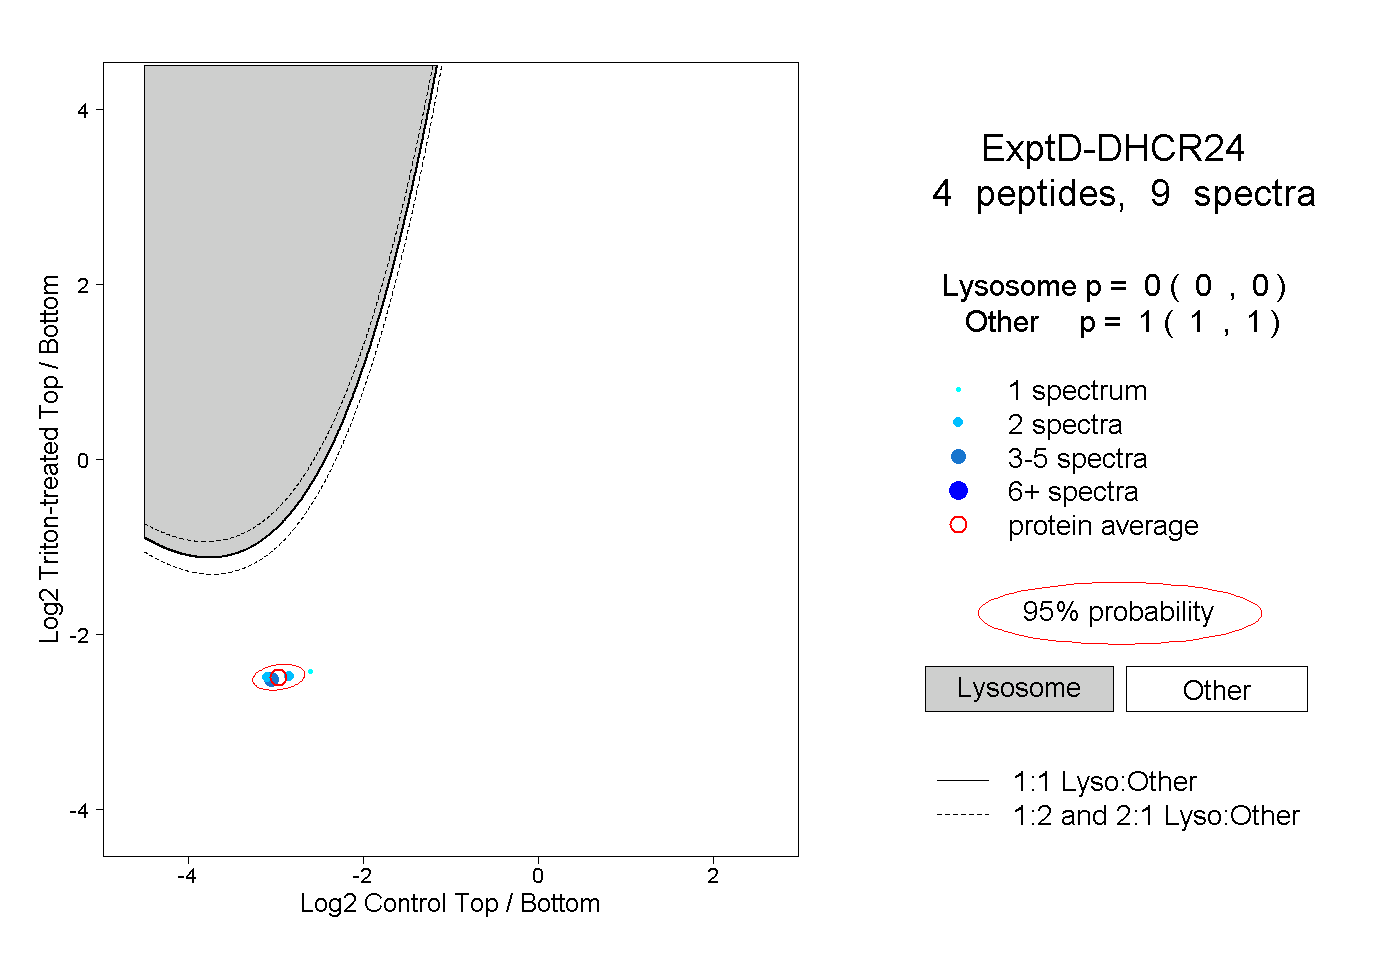 |
0.000 0.000 | 0.000 |
1.000 1.000 | 1.000 |