 5
5peptides
spectra
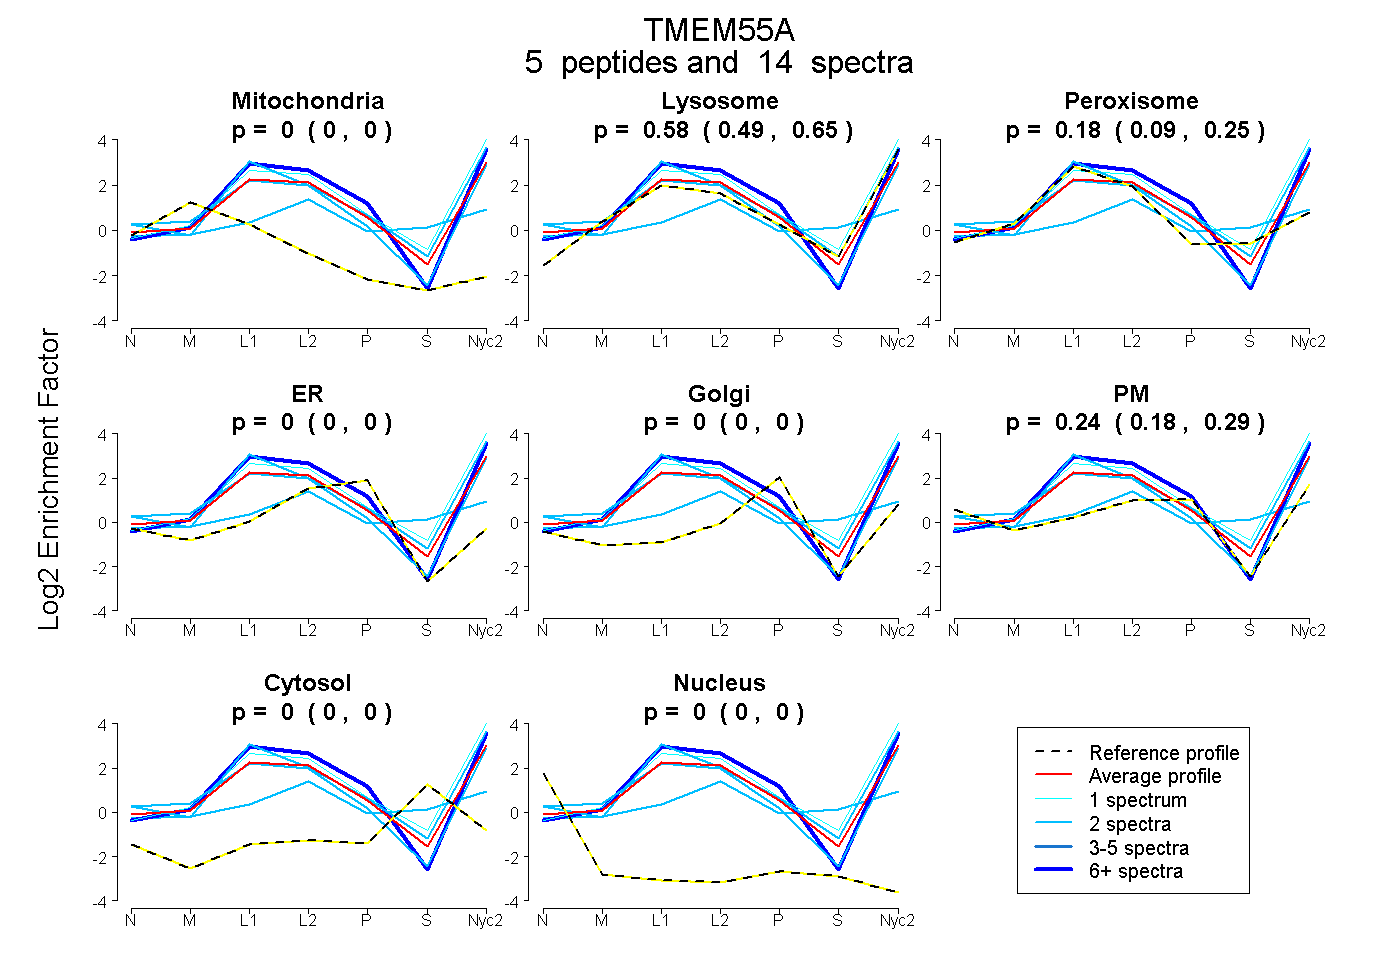
0.000 | 0.000
0.486 | 0.653
0.094 | 0.252
0.000 | 0.000
0.000 | 0.000
0.180 | 0.294
0.000 | 0.000
0.000 | 0.000
4peptides
spectra
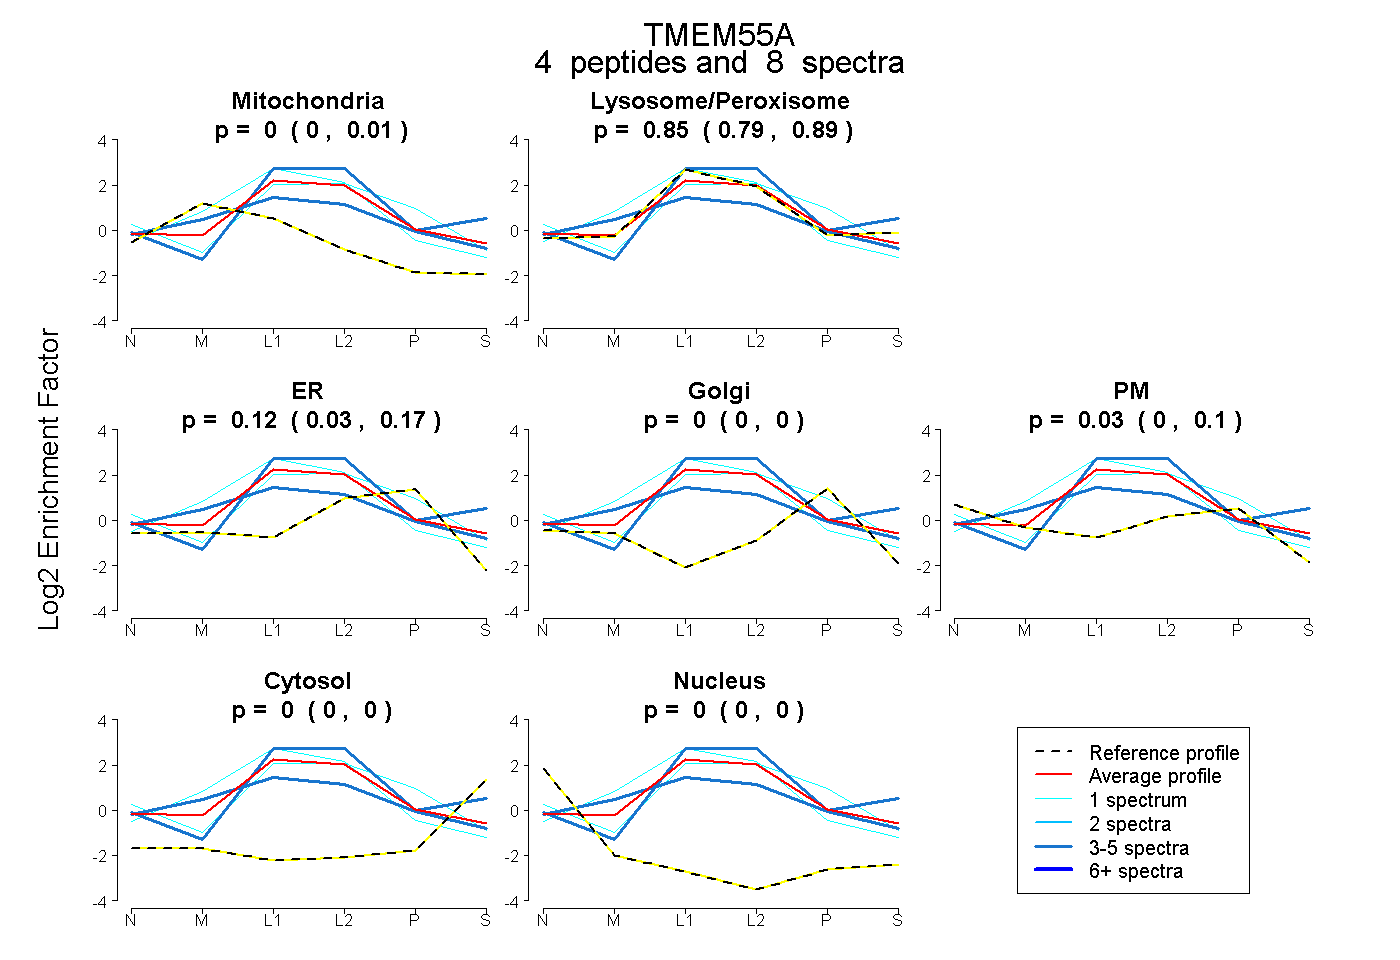
0.000 | 0.013
0.794 | 0.894
0.032 | 0.172
0.000 | 0.000
0.000 | 0.099
0.000 | 0.000
0.000 | 0.000
11peptides
spectra
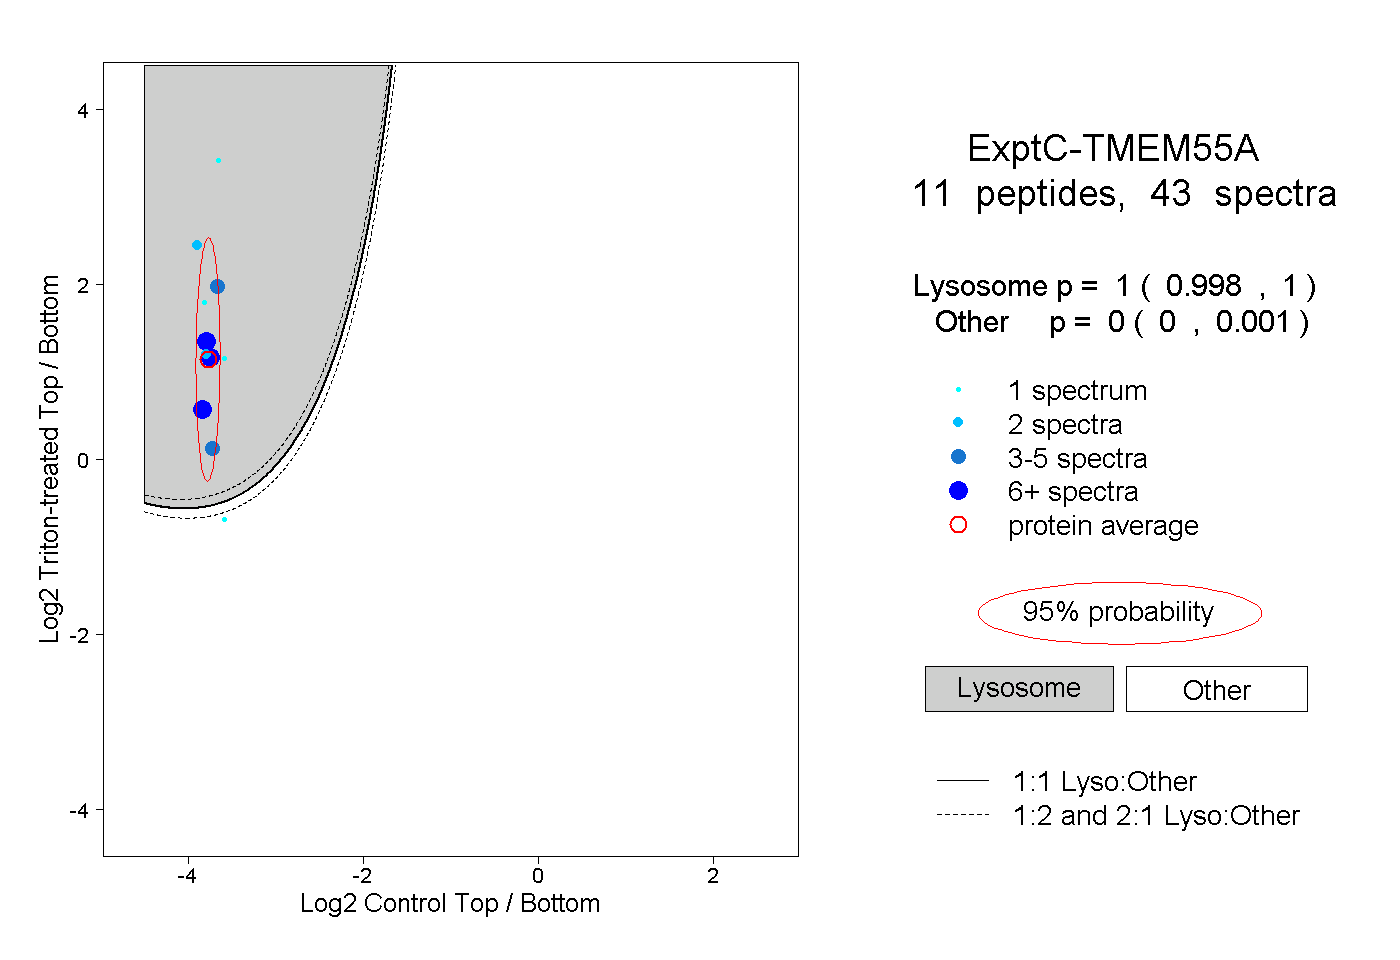
0.998 | 1.000
0.000 | 0.001
3peptides
spectra
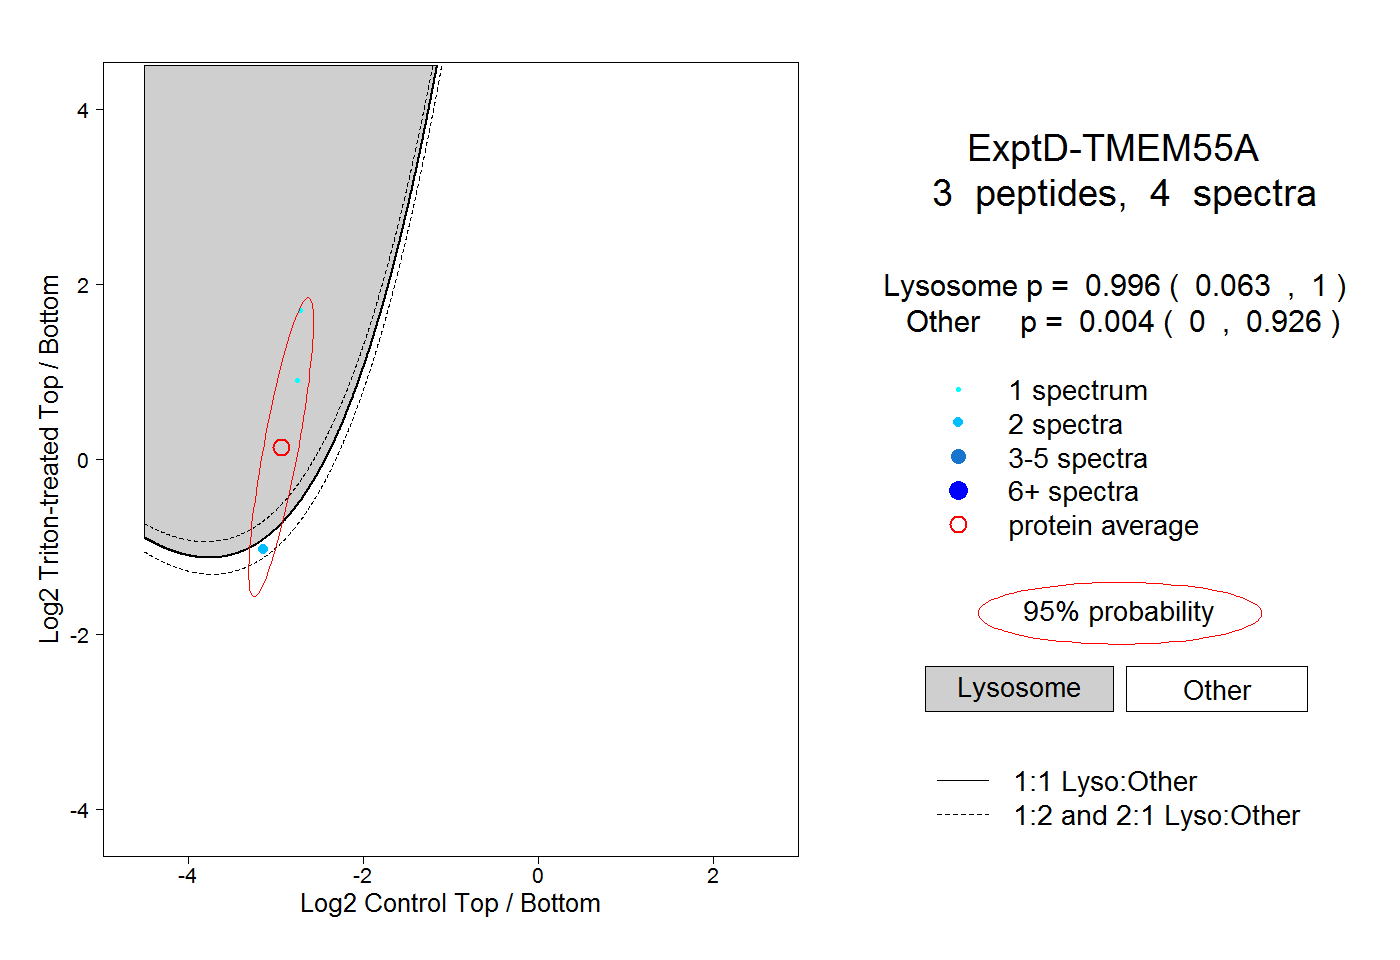
0.063 | 1.000
0.000 | 0.926