TMEM55A
[ENSRNOP00000009375]
Main page
| | | Plot |
Mito |
Lyso |
|
Perox |
ER |
Golgi |
PM |
Cytosol |
Nucleus |
|
| Expt A |
 5
5
peptides |
14
spectra |
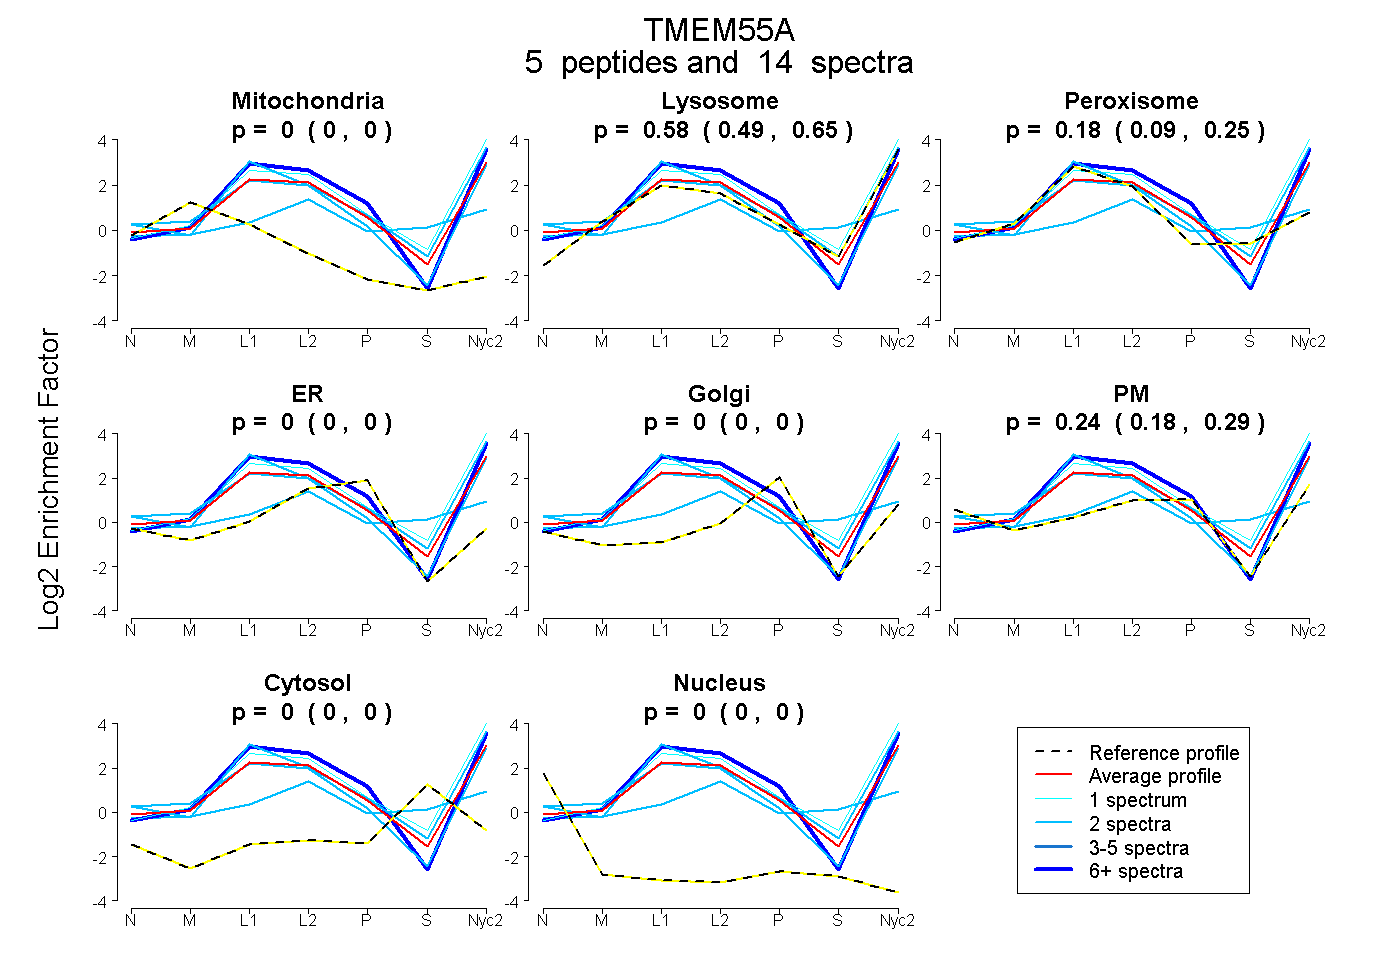 |
0.000
0.000 | 0.000 |
0.578
0.486 | 0.653 |
|
0.181
0.094 | 0.252 |
0.000
0.000 | 0.000 |
0.000
0.000 | 0.000 |
0.242
0.180 | 0.294 |
0.000
0.000 | 0.000 |
0.000
0.000 | 0.000 |
|
| | | Plot |
Mito |
|
Lyso or Perox |
|
ER |
Golgi |
PM |
Cytosol |
Nucleus |
|
| Expt B |
4
peptides |
8
spectra |
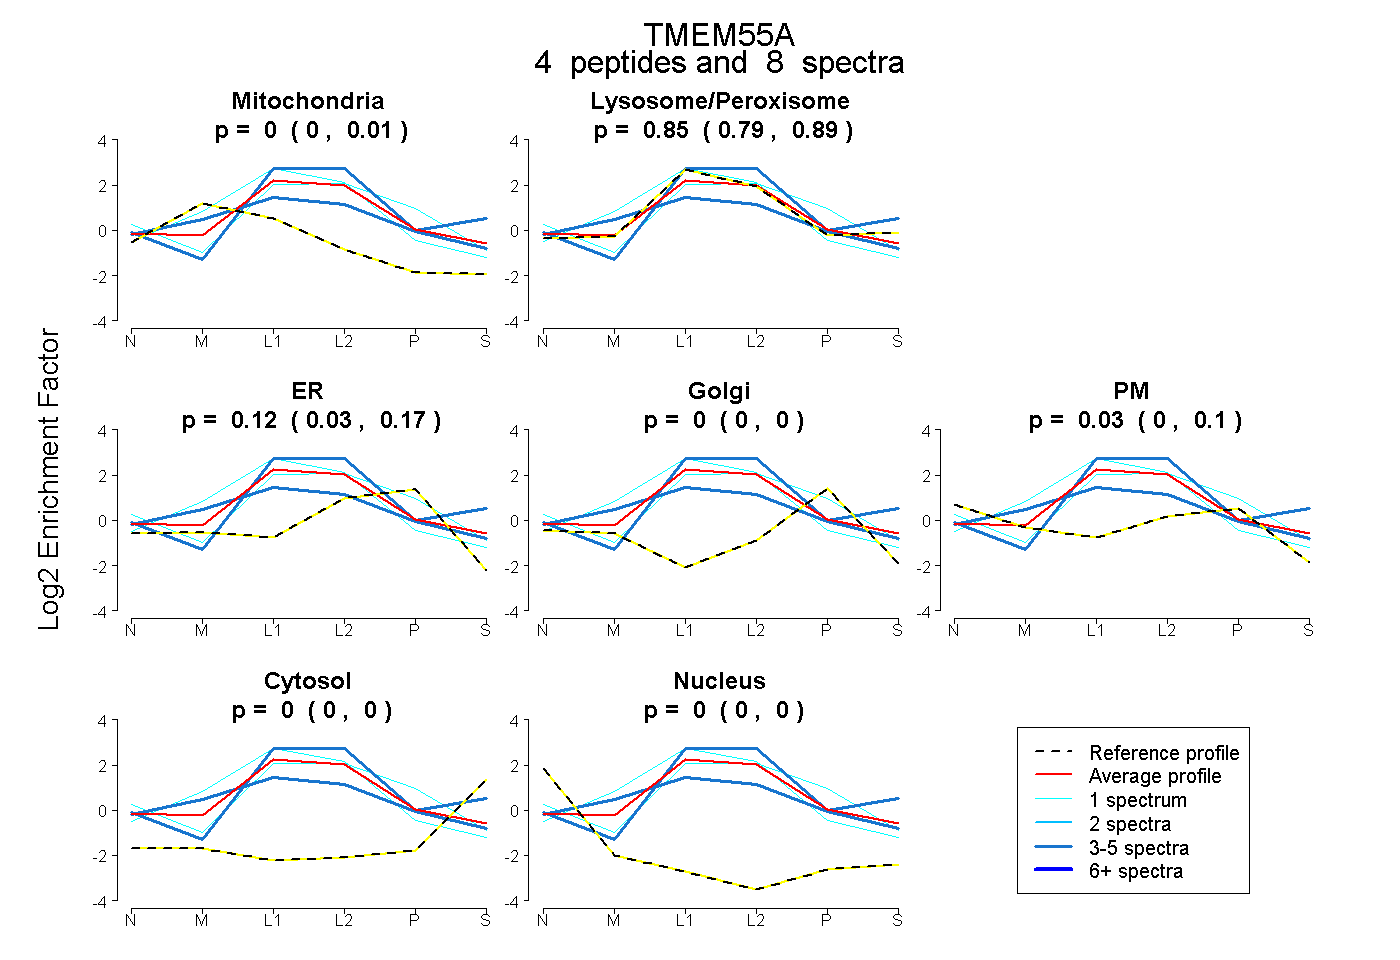 |
0.000
0.000 | 0.013 |
|
0.850
0.794 | 0.894 |
|
0.123
0.032 | 0.172 |
0.000
0.000 | 0.000 |
0.027
0.000 | 0.099 |
0.000
0.000 | 0.000 |
0.000
0.000 | 0.000 |
|
| | | Plot |
|
Lyso |
|
|
|
|
|
|
|
Other |
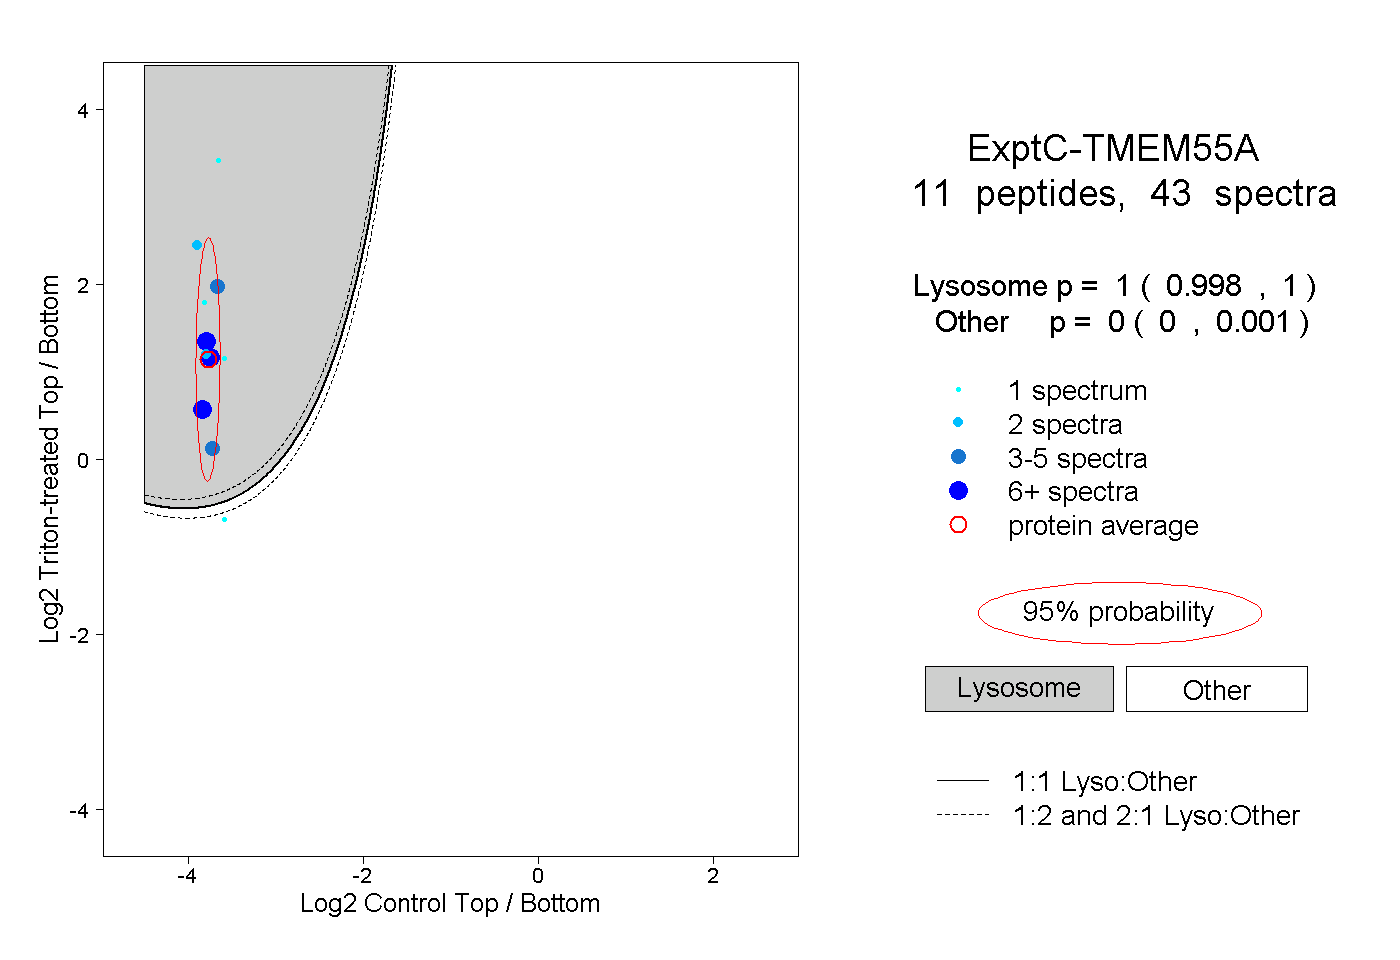
| Expt C |
11
peptides |
43
spectra |
 |
|
1.000
0.998 | 1.000 |
|
|
|
|
|
|
|
0.000
0.000 | 0.001 |
| 1 spectrum, CPHCK |
|
1.000 |
|
|
|
|
|
|
|
0.000 |
| 2 spectra, ACYWGAIR |
|
1.000 |
|
|
|
|
|
|
|
0.000 |
| 1 spectrum, VSYPEHGFA |
|
0.090 |
|
|
|
|
|
|
|
0.910 |
| 2 spectra, ISSVGSALPR |
|
1.000 |
|
|
|
|
|
|
|
0.000 |
| 1 spectrum, LHQHVVK |
|
1.000 |
|
|
|
|
|
|
|
0.000 |
| 1 spectrum, CTVCNEATPIK |
|
1.000 |
|
|
|
|
|
|
|
0.000 |
| 11 spectra, TPPTGK |
|
1.000 |
|
|
|
|
|
|
|
0.000 |
| 4 spectra, CPCNCLLICK |
|
1.000 |
|
|
|
|
|
|
|
0.000 |
| 10 spectra, FNTLAK |
|
1.000 |
|
|
|
|
|
|
|
0.000 |
| 7 spectra, IGCPRPNCR |
|
1.000 |
|
|
|
|
|
|
|
0.000 |
| 3 spectra, VCQSLINLDGK |
|
1.000 |
|
|
|
|
|
|
|
0.000 |
| | | Plot |
|
Lyso |
|
|
|
|
|
|
|
Other |
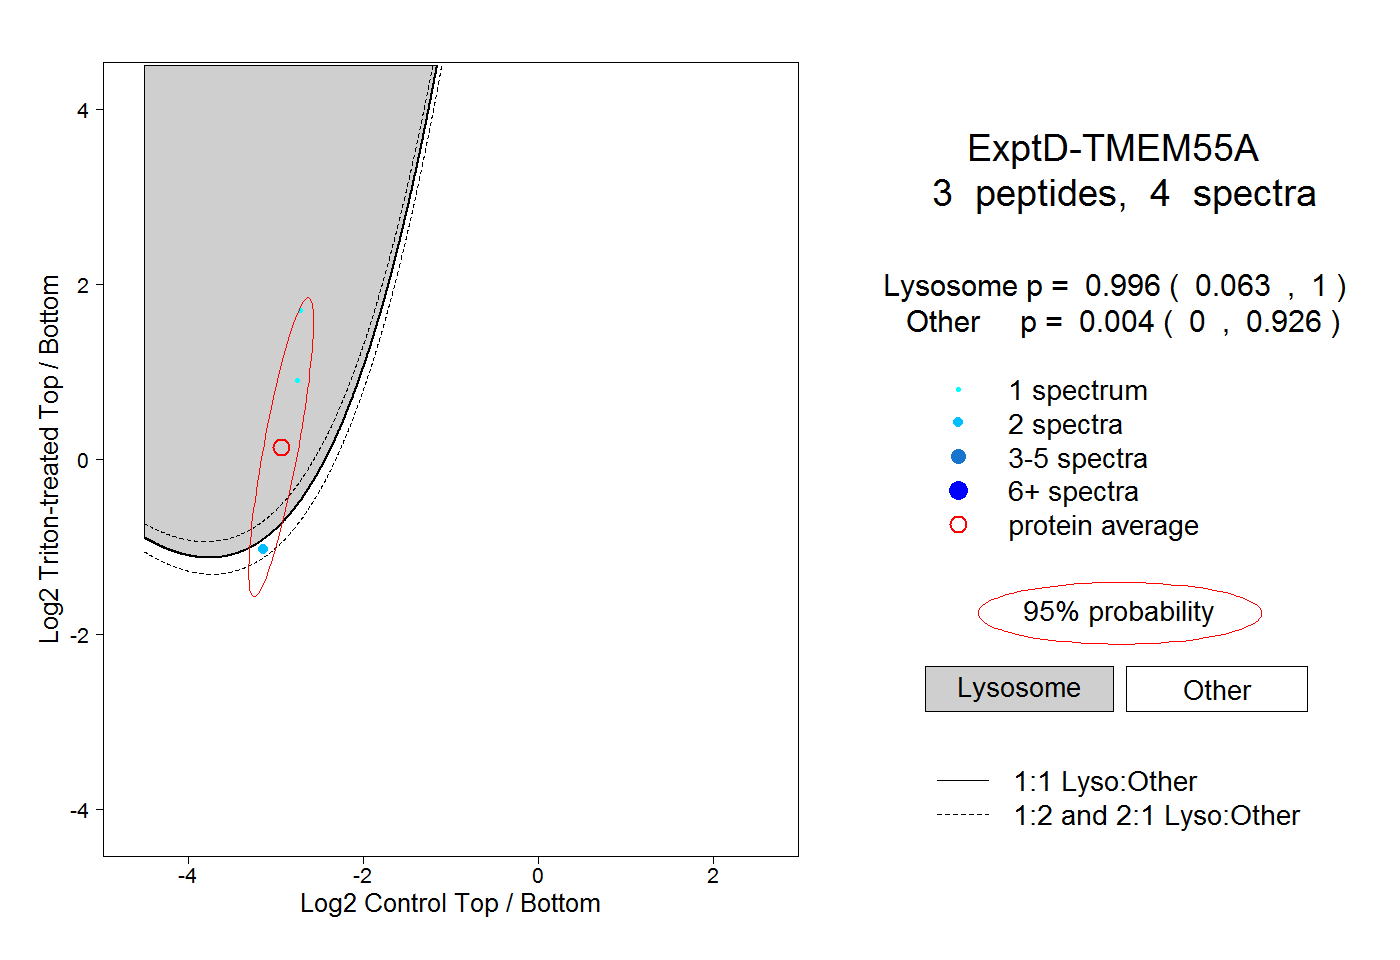
| Expt D |
3
peptides |
4
spectra |
 |
|
0.996
0.063 | 1.000 |
|
|
|
|
|
|
|
0.004
0.000 | 0.926 |