 5
5peptides
spectra
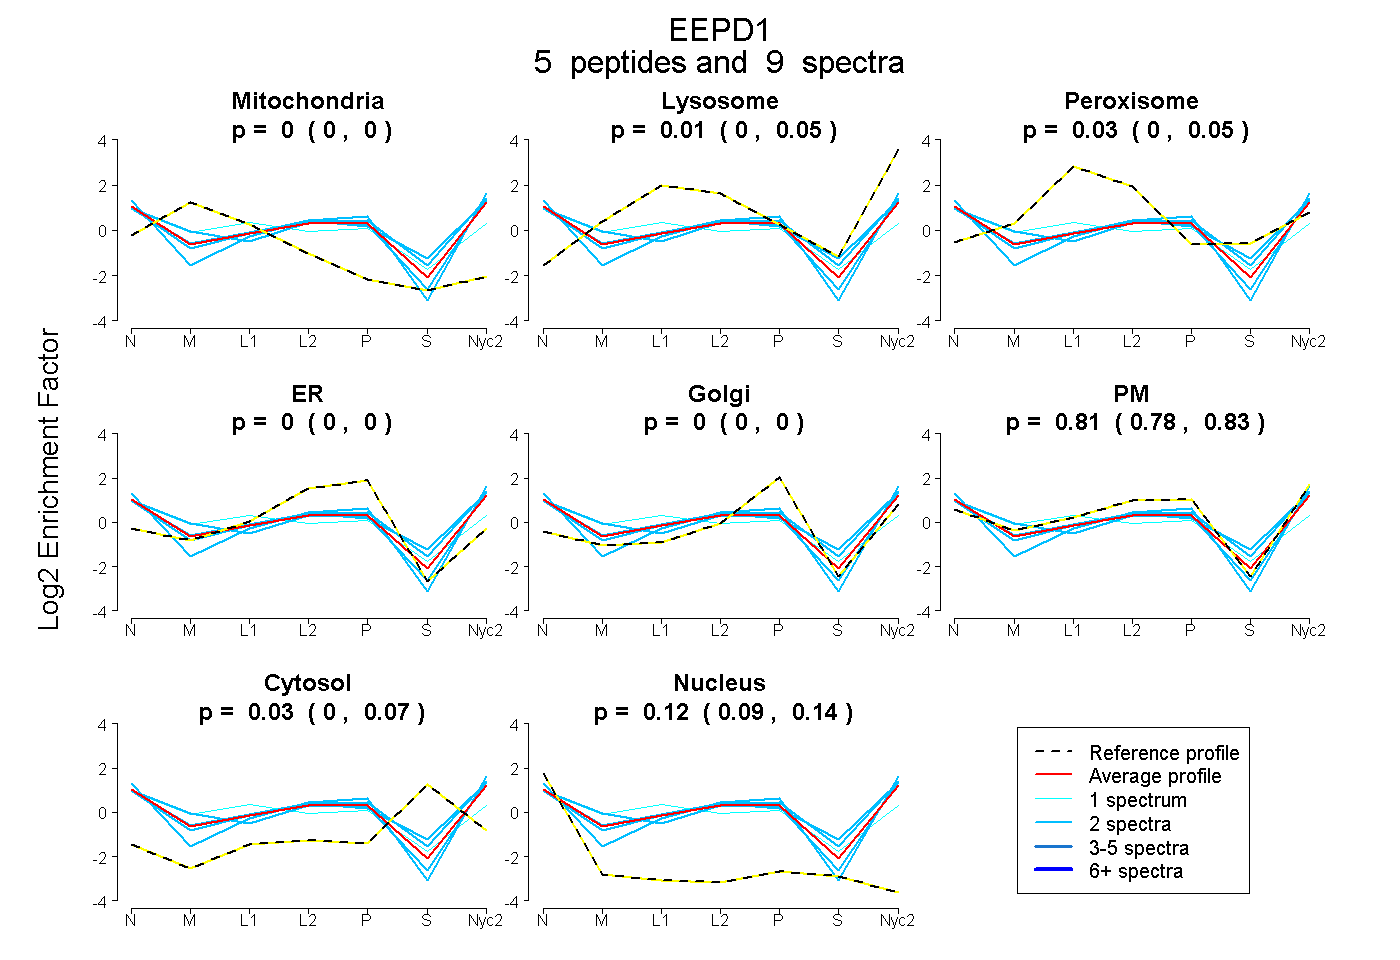
0.000 | 0.000
0.000 | 0.054
0.000 | 0.054
0.000 | 0.000
0.000 | 0.000
0.781 | 0.834
0.000 | 0.066
0.094 | 0.143
1peptide
spectrum
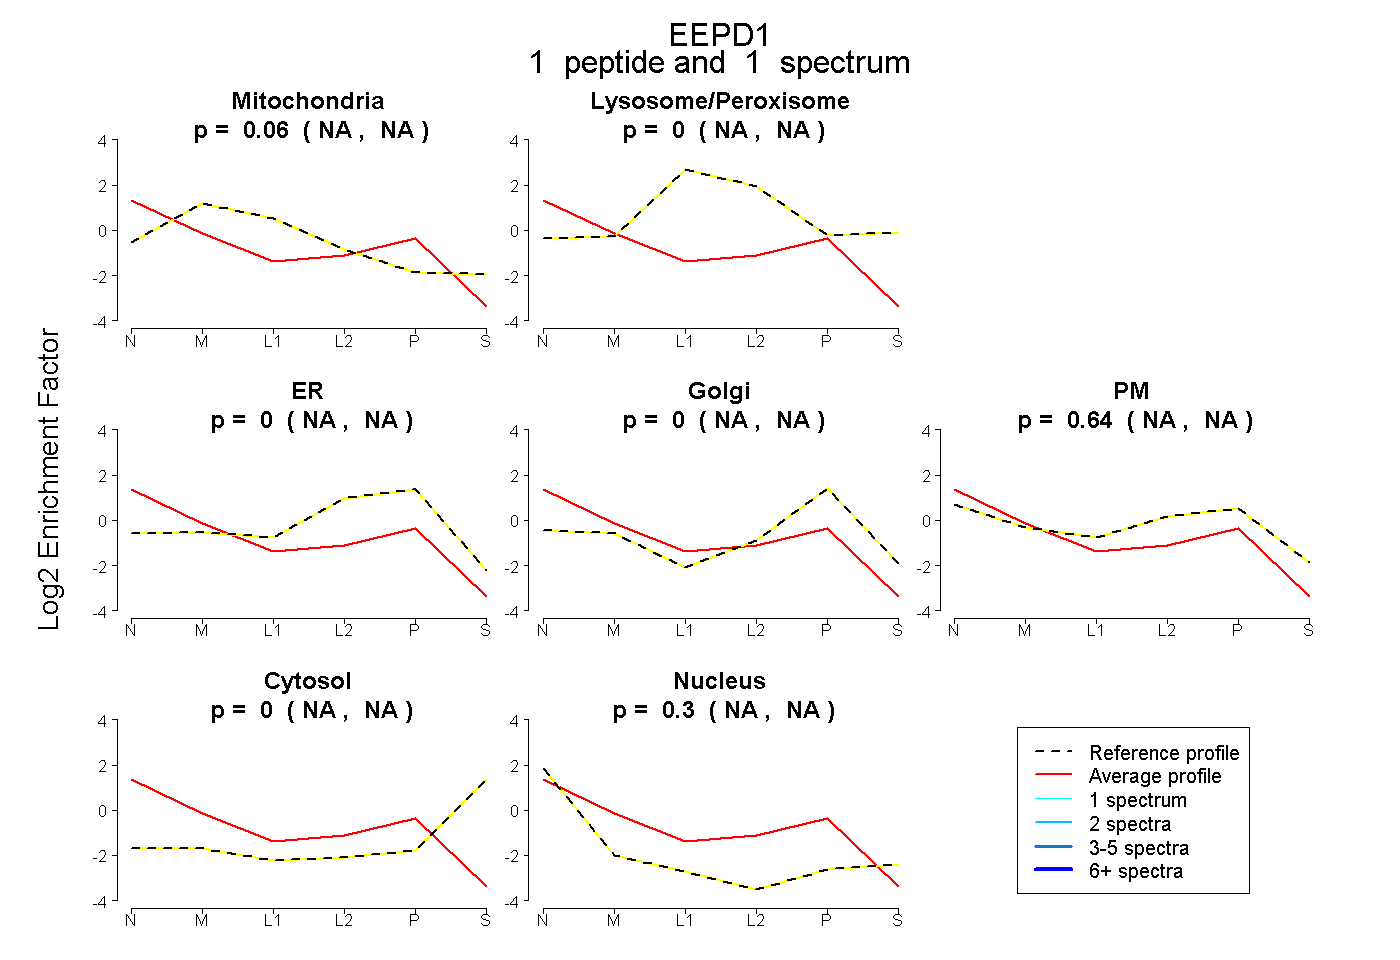
NA | NA
NA | NA
NA | NA
NA | NA
NA | NA
NA | NA
NA | NA
3peptides
spectra
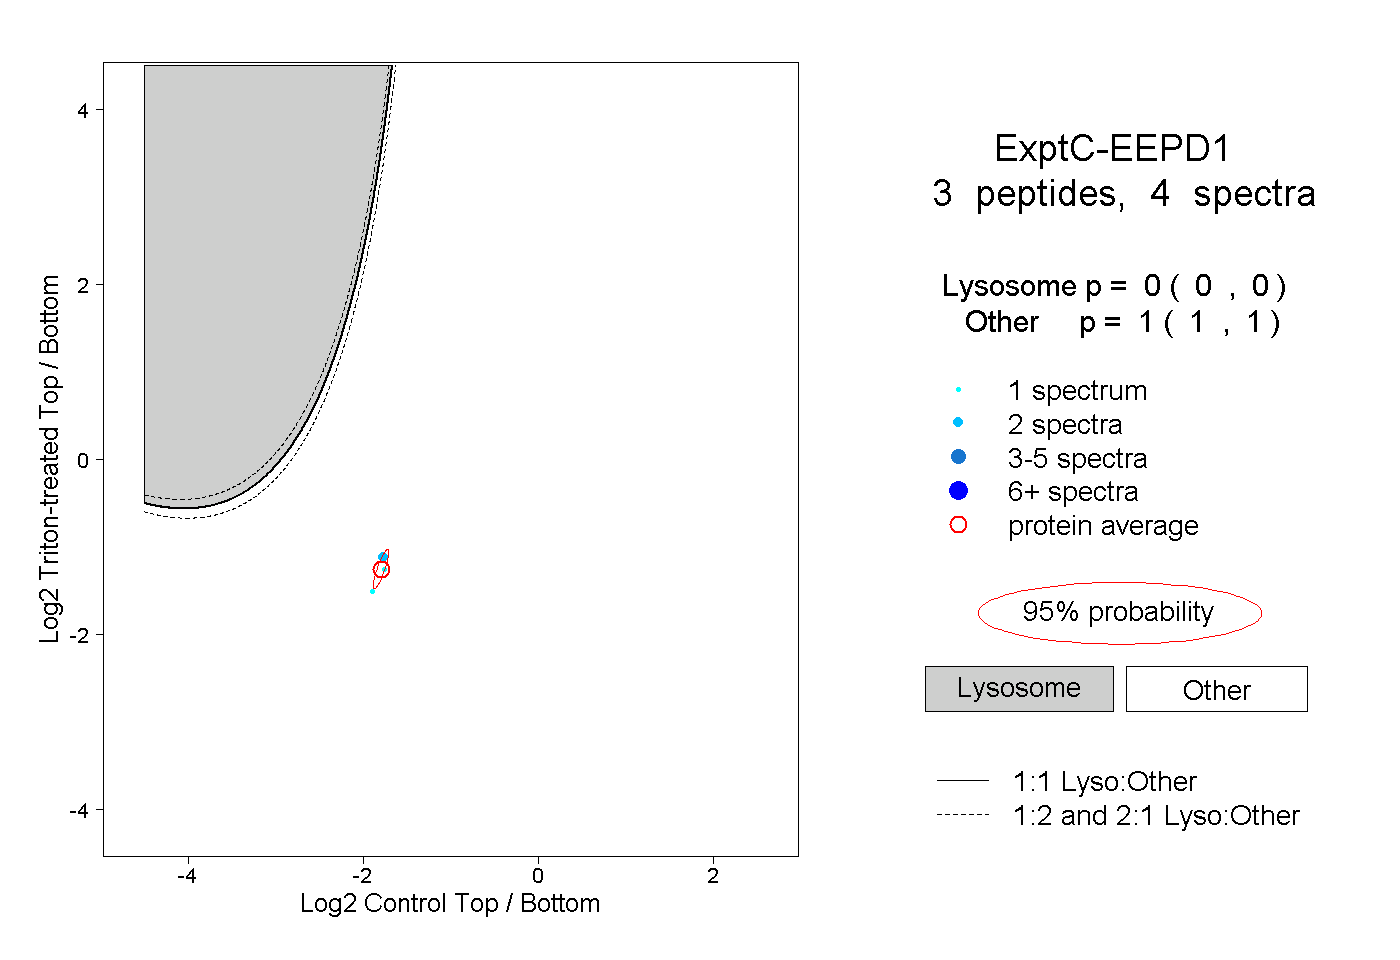
0.000 | 0.000
1.000 | 1.000