 5
5peptides
spectra
0.000 | 0.000
0.000 | 0.054
0.000 | 0.054
0.000 | 0.000
0.000 | 0.000
0.781 | 0.834
0.000 | 0.066
0.094 | 0.143
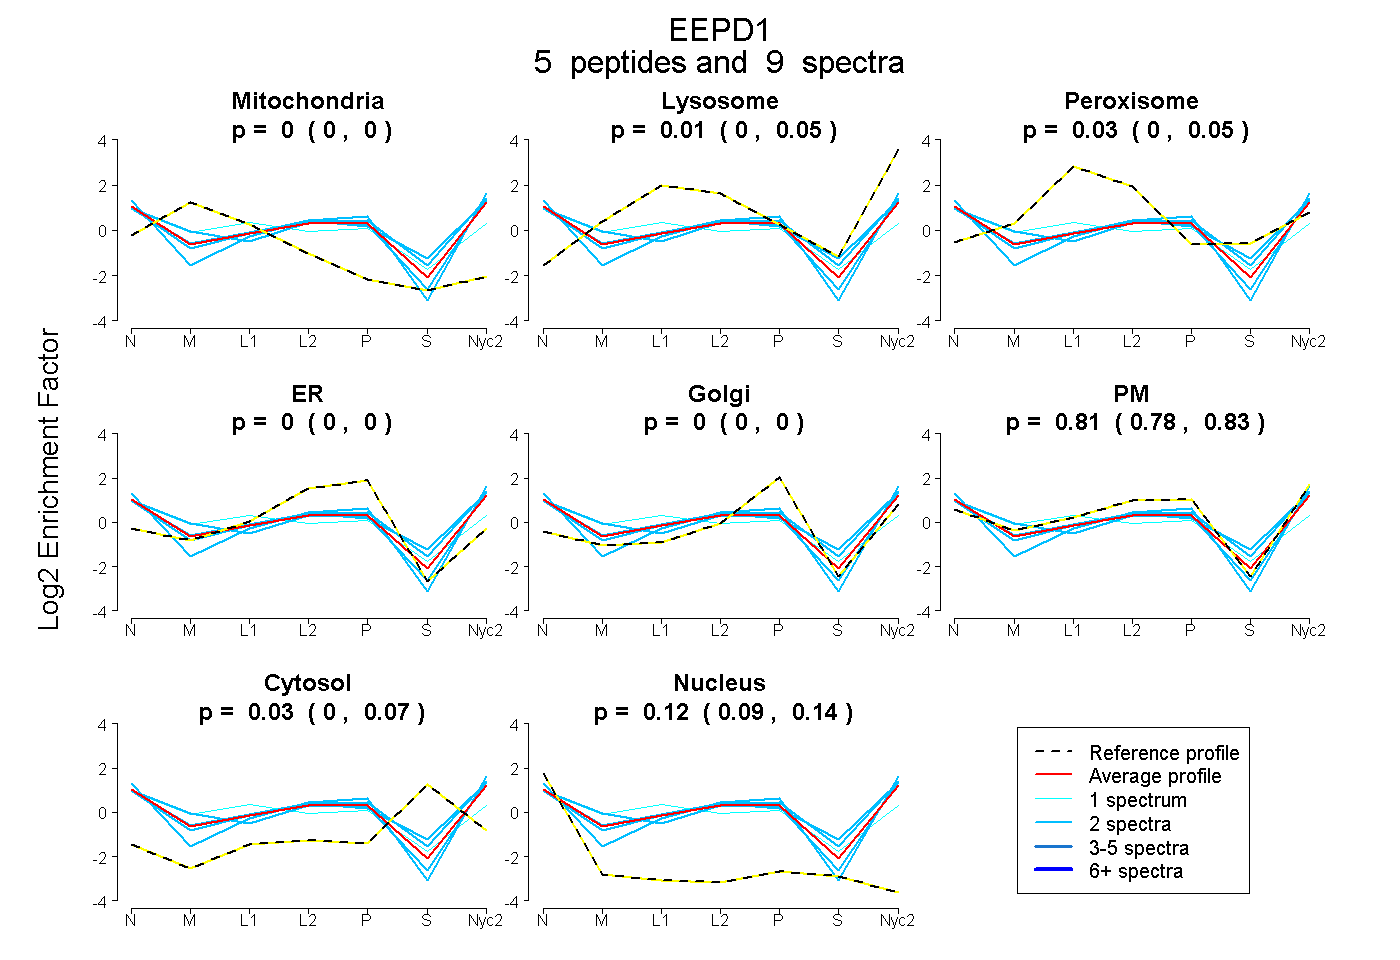
| Plot | Mito | Lyso | Perox | ER | Golgi | PM | Cytosol | Nucleus | |||||
| Expt A |
5 peptides |
9 spectra |
|
0.000 0.000 | 0.000 |
0.010 0.000 | 0.054 |
0.029 0.000 | 0.054 |
0.000 0.000 | 0.000 |
0.000 0.000 | 0.000 |
0.814 0.781 | 0.834 |
0.027 0.000 | 0.066 |
0.122 0.094 | 0.143 |
| 2 spectra, SVDNIWISK | 0.000 | 0.000 | 0.039 | 0.000 | 0.000 | 0.742 | 0.182 | 0.037 | ||
| 1 spectrum, EYIGGFK | 0.120 | 0.000 | 0.181 | 0.000 | 0.000 | 0.554 | 0.005 | 0.139 | ||
| 2 spectra, SVEDLVR | 0.000 | 0.000 | 0.000 | 0.000 | 0.000 | 0.874 | 0.000 | 0.126 | ||
| 2 spectra, TVGPSPFLAR | 0.059 | 0.000 | 0.000 | 0.000 | 0.000 | 0.849 | 0.000 | 0.092 | ||
| 2 spectra, ANNPGVR | 0.000 | 0.000 | 0.019 | 0.000 | 0.000 | 0.815 | 0.126 | 0.041 |
| Plot | Mito | Lyso or Perox | ER | Golgi | PM | Cytosol | Nucleus | ||||||
| Expt B |
1 peptide |
1 spectrum |
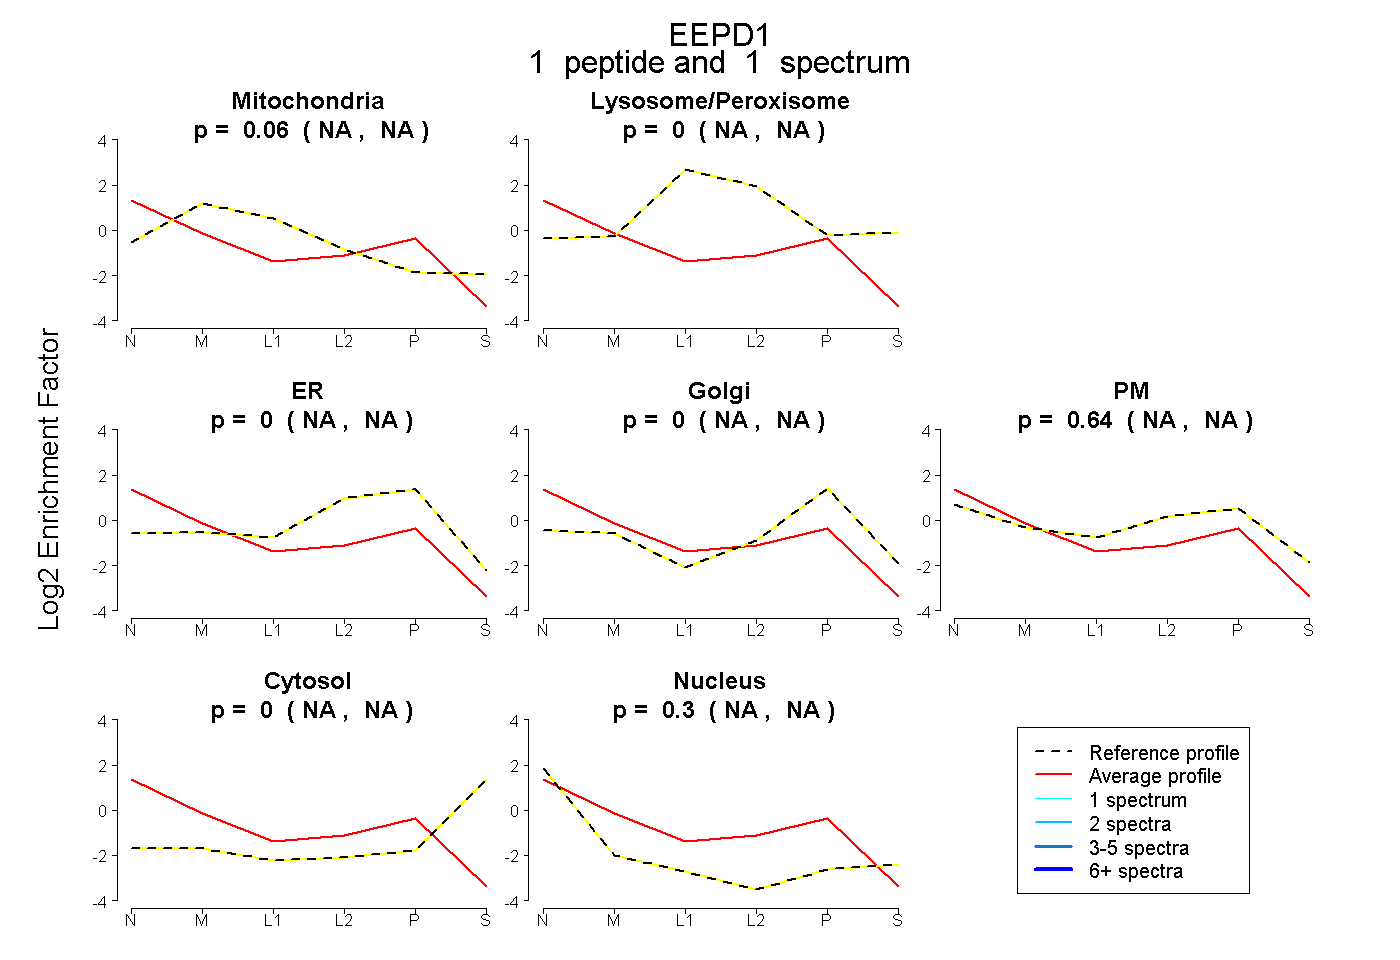 |
0.061 NA | NA |
0.000 NA | NA |
0.000 NA | NA |
0.000 NA | NA |
0.638 NA | NA |
0.000 NA | NA |
0.301 NA | NA |
|||
| Plot | Lyso | Other | |||||||||||
| Expt C |
3 peptides |
4 spectra |
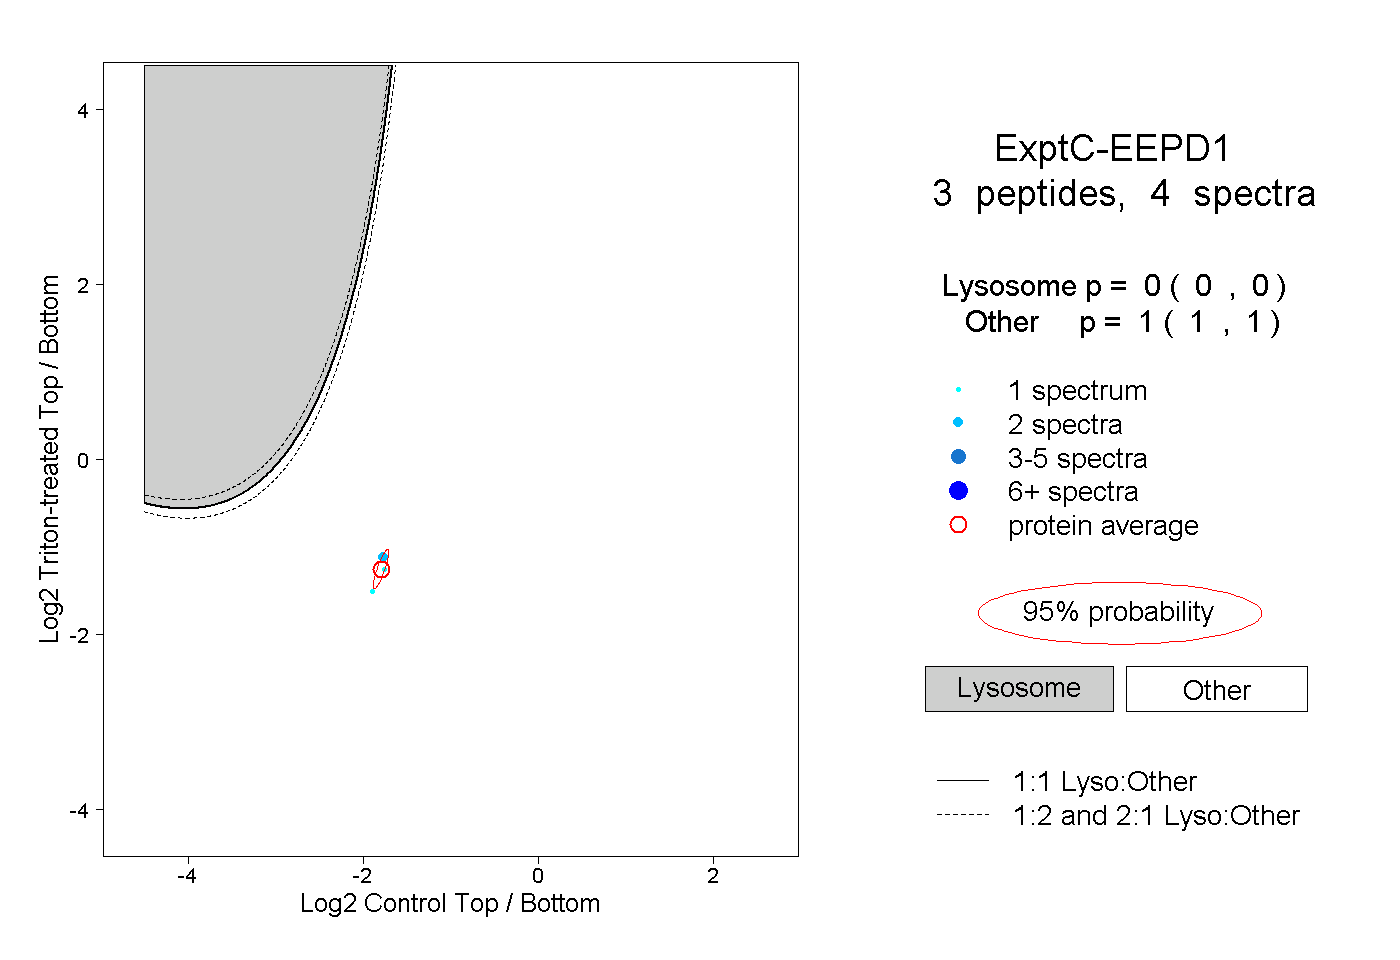 |
0.000 0.000 | 0.000 |
1.000 1.000 | 1.000 |