 2
2peptides
spectra
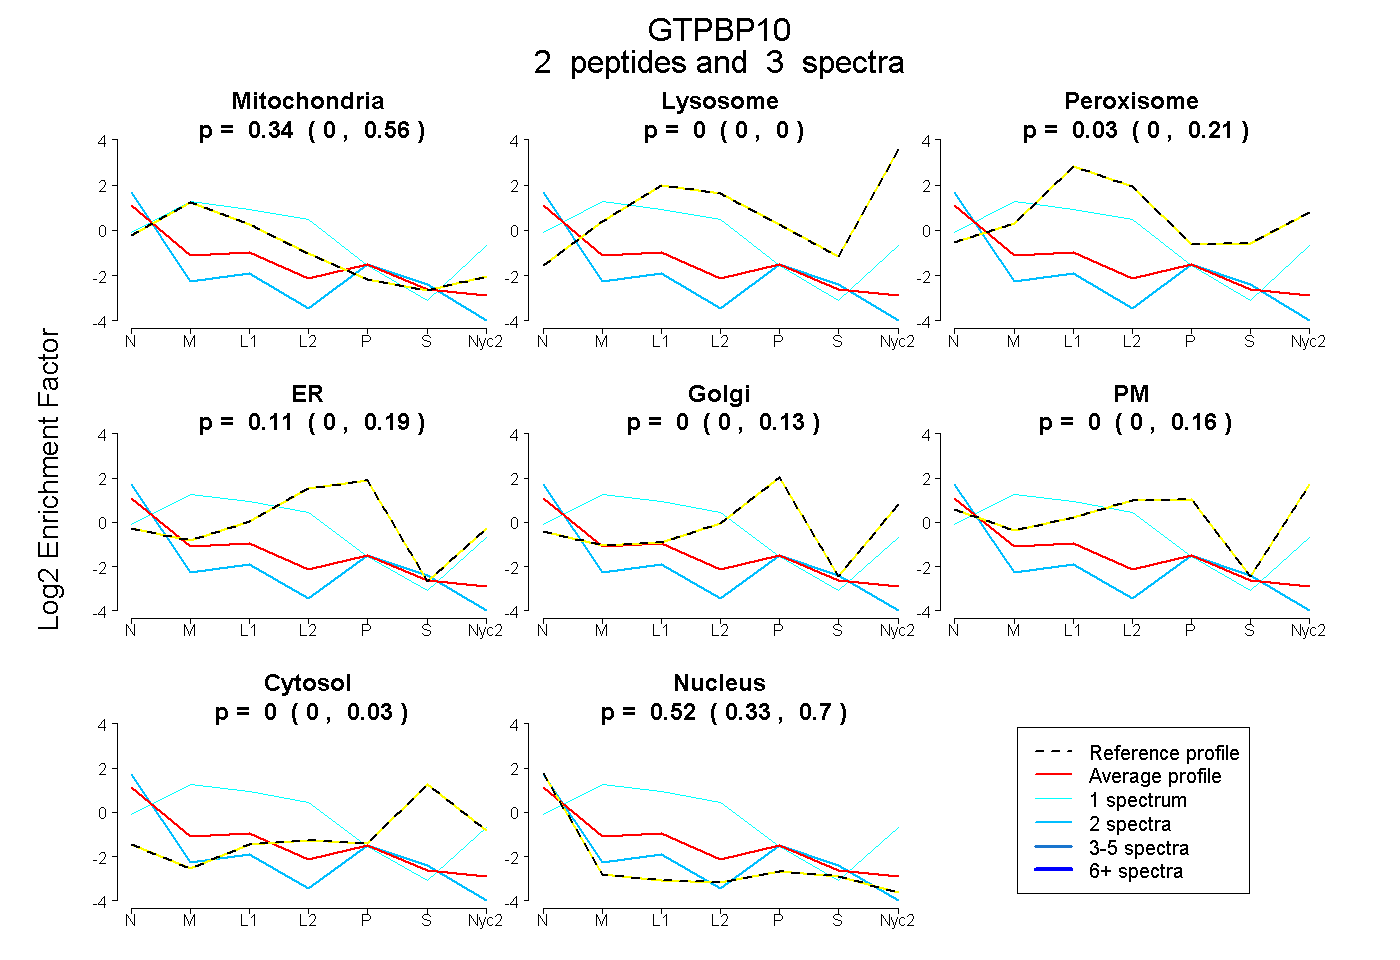
0.000 | 0.560
0.000 | 0.002
0.000 | 0.211
0.000 | 0.191
0.000 | 0.130
0.000 | 0.161
0.000 | 0.031
0.327 | 0.696
6peptides
spectra
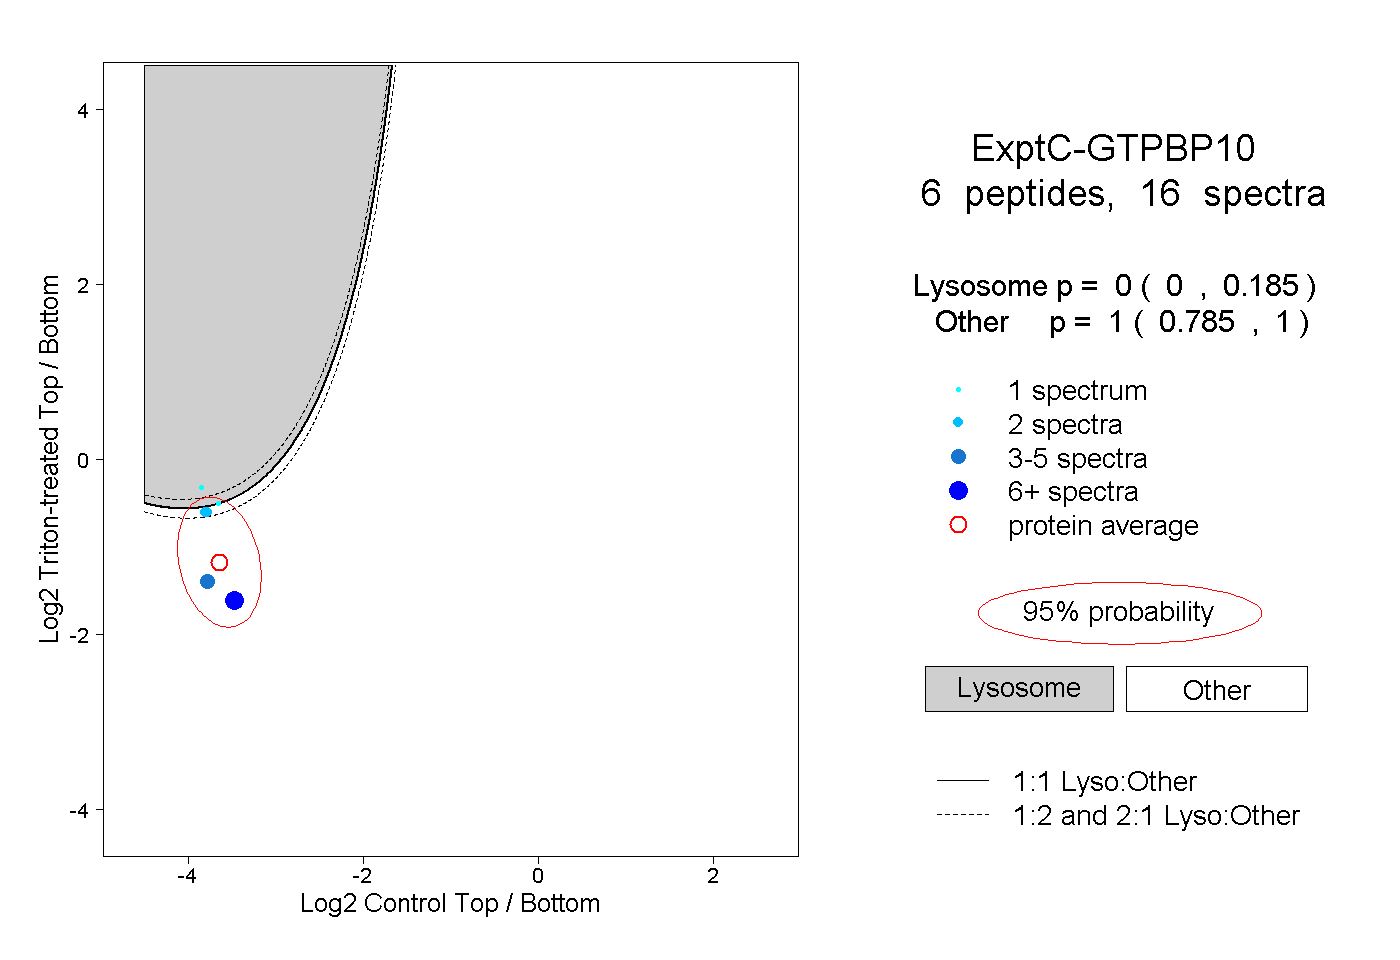
0.000 | 0.185
0.785 | 1.000
2peptides
spectra
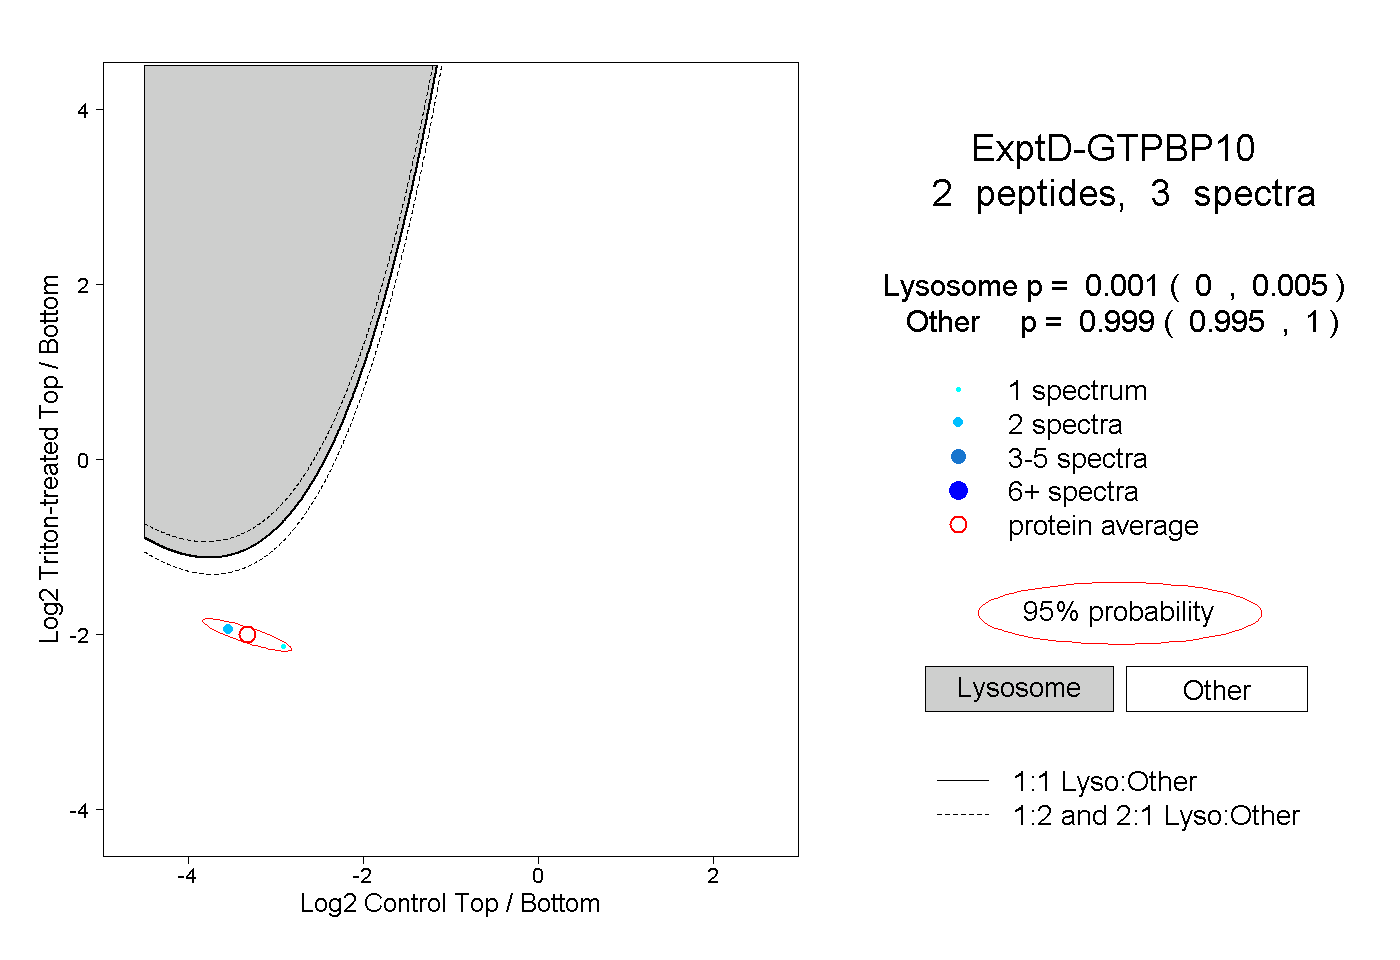
0.000 | 0.005
0.995 | 1.000