 2
2peptides
spectra
0.000 | 0.560
0.000 | 0.002
0.000 | 0.211
0.000 | 0.191
0.000 | 0.130
0.000 | 0.161
0.000 | 0.031
0.327 | 0.696
6peptides
spectra
0.000 | 0.185
0.785 | 1.000
| Plot | Mito | Lyso | Perox | ER | Golgi | PM | Cytosol | Nucleus | |||||
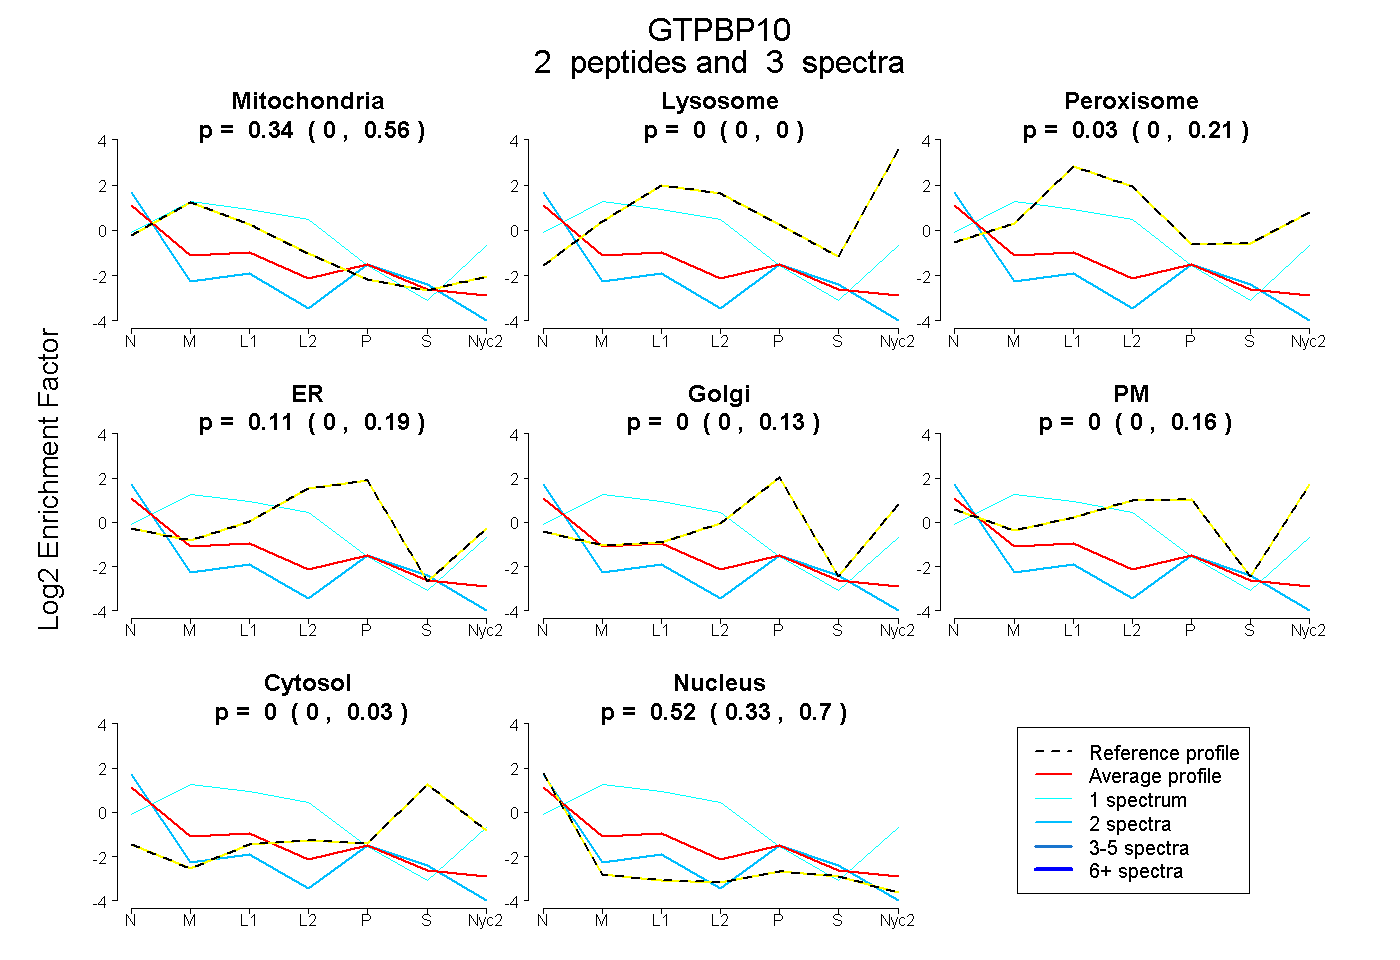
| Expt A |
2 peptides |
3 spectra |
|
0.338 0.000 | 0.560 |
0.000 0.000 | 0.002 |
0.027 0.000 | 0.211 |
0.113 0.000 | 0.191 |
0.000 0.000 | 0.130 |
0.000 0.000 | 0.161 |
0.000 0.000 | 0.031 |
0.522 0.327 | 0.696 |
||
| Plot | Lyso | Other | |||||||||||
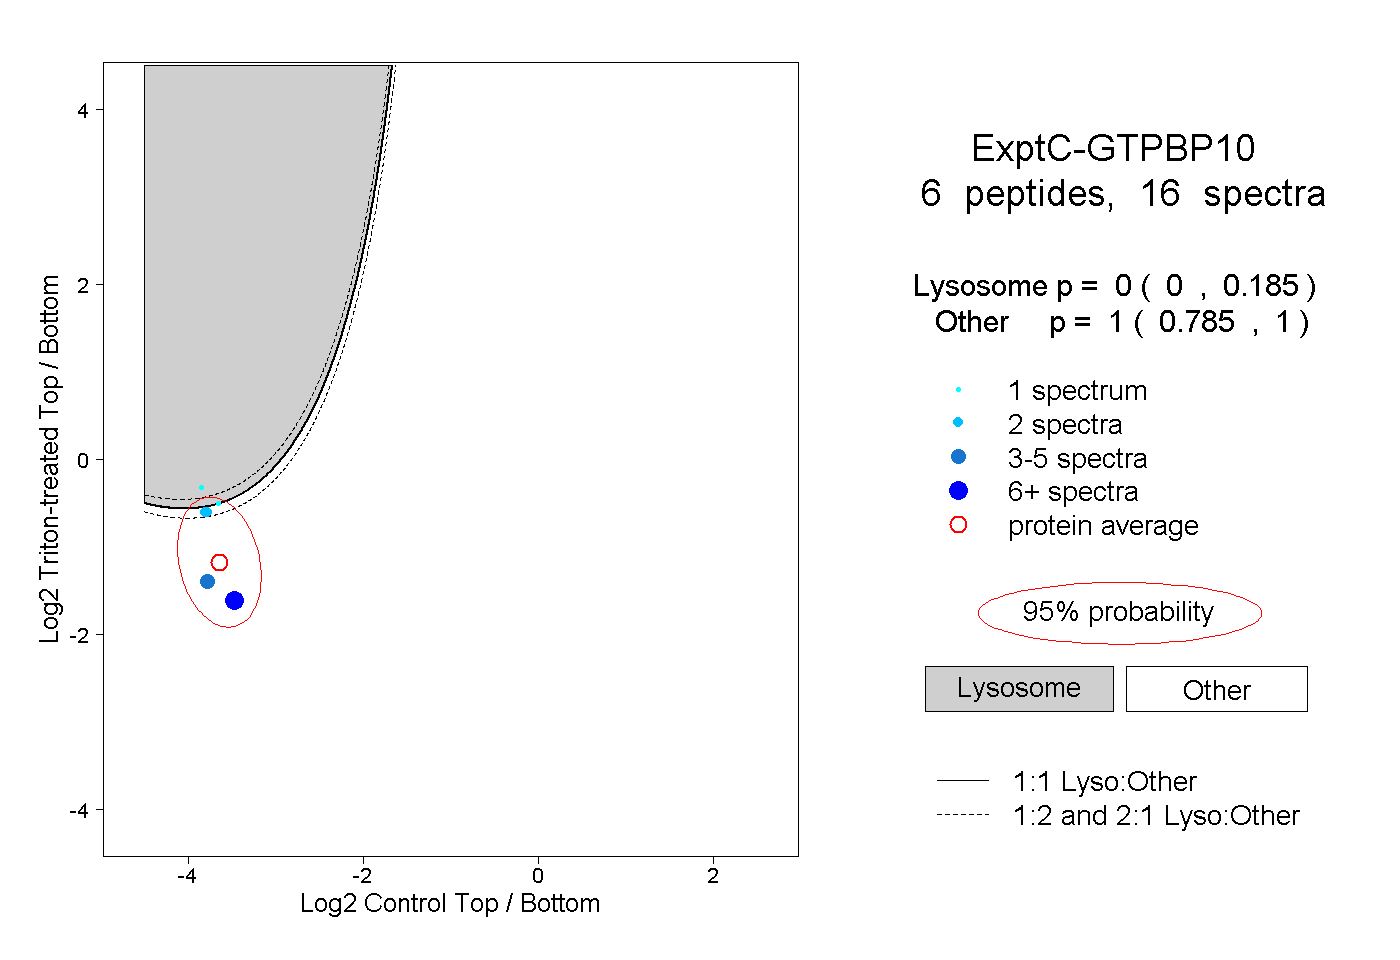
| Expt C |
6 peptides |
16 spectra |
|
0.000 0.000 | 0.185 |
1.000 0.785 | 1.000 |
| 3 spectra, IIHLDLK | 0.000 | 1.000 | ||||||||
| 2 spectra, YGNFIDNLR | 0.290 | 0.710 | ||||||||
| 1 spectrum, QLQKPEDFLHLFEAK | 0.945 | 0.055 | ||||||||
| 7 spectra, GGLGGK | 0.000 | 1.000 | ||||||||
| 1 spectrum, MDLPDAQVK | 0.496 | 0.504 | ||||||||
| 2 spectra, FVAGGGANSR | 0.309 | 0.691 |
| Plot | Lyso | Other | |||||||||||
| Expt D |
2 peptides |
3 spectra |
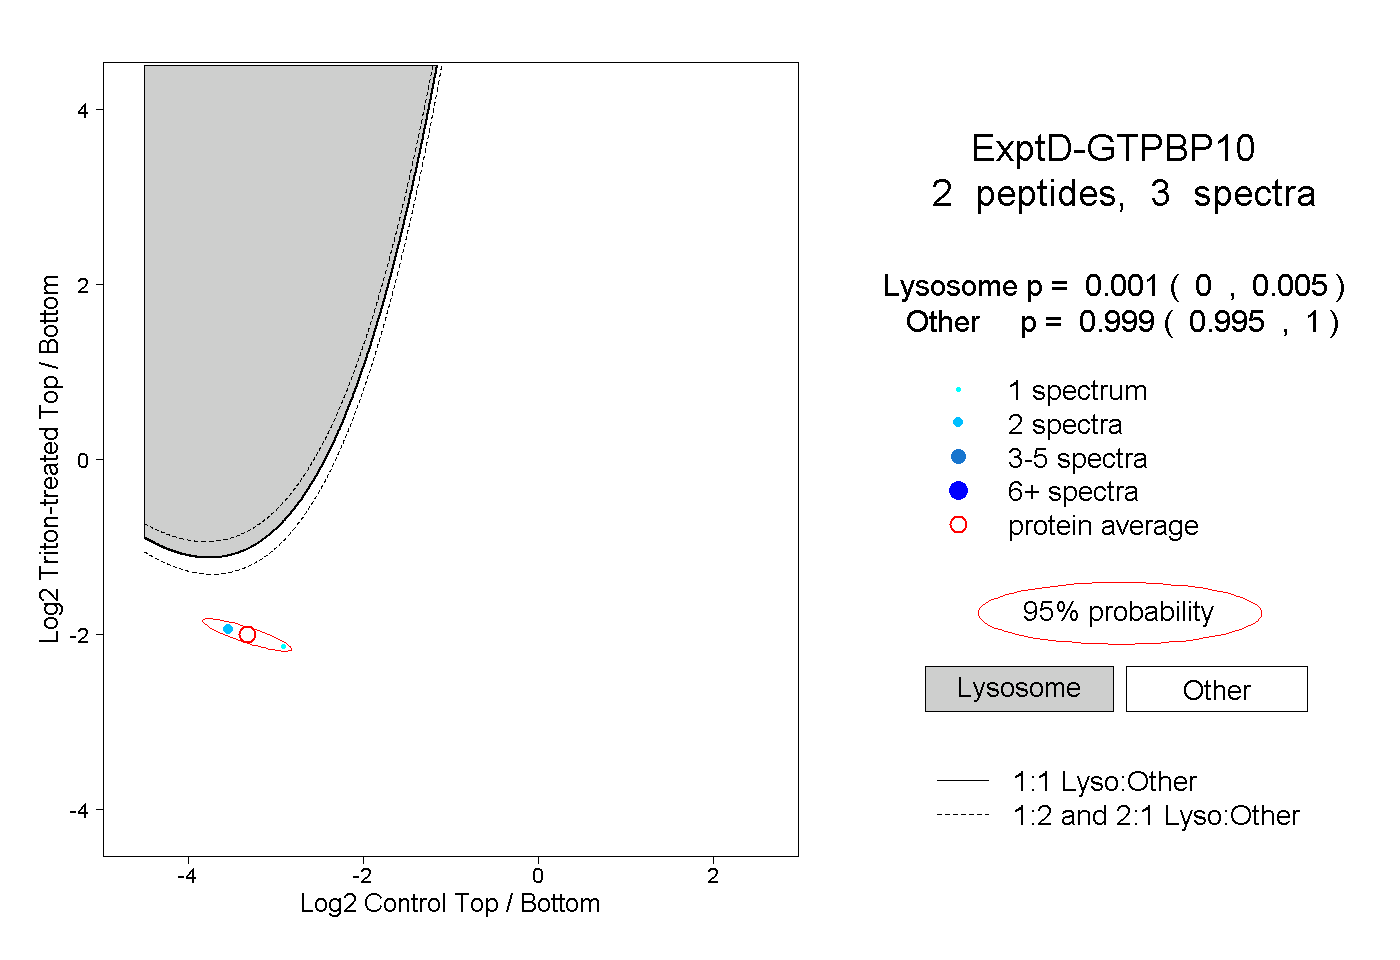 |
0.001 0.000 | 0.005 |
0.999 0.995 | 1.000 |