 5
5peptides
spectra
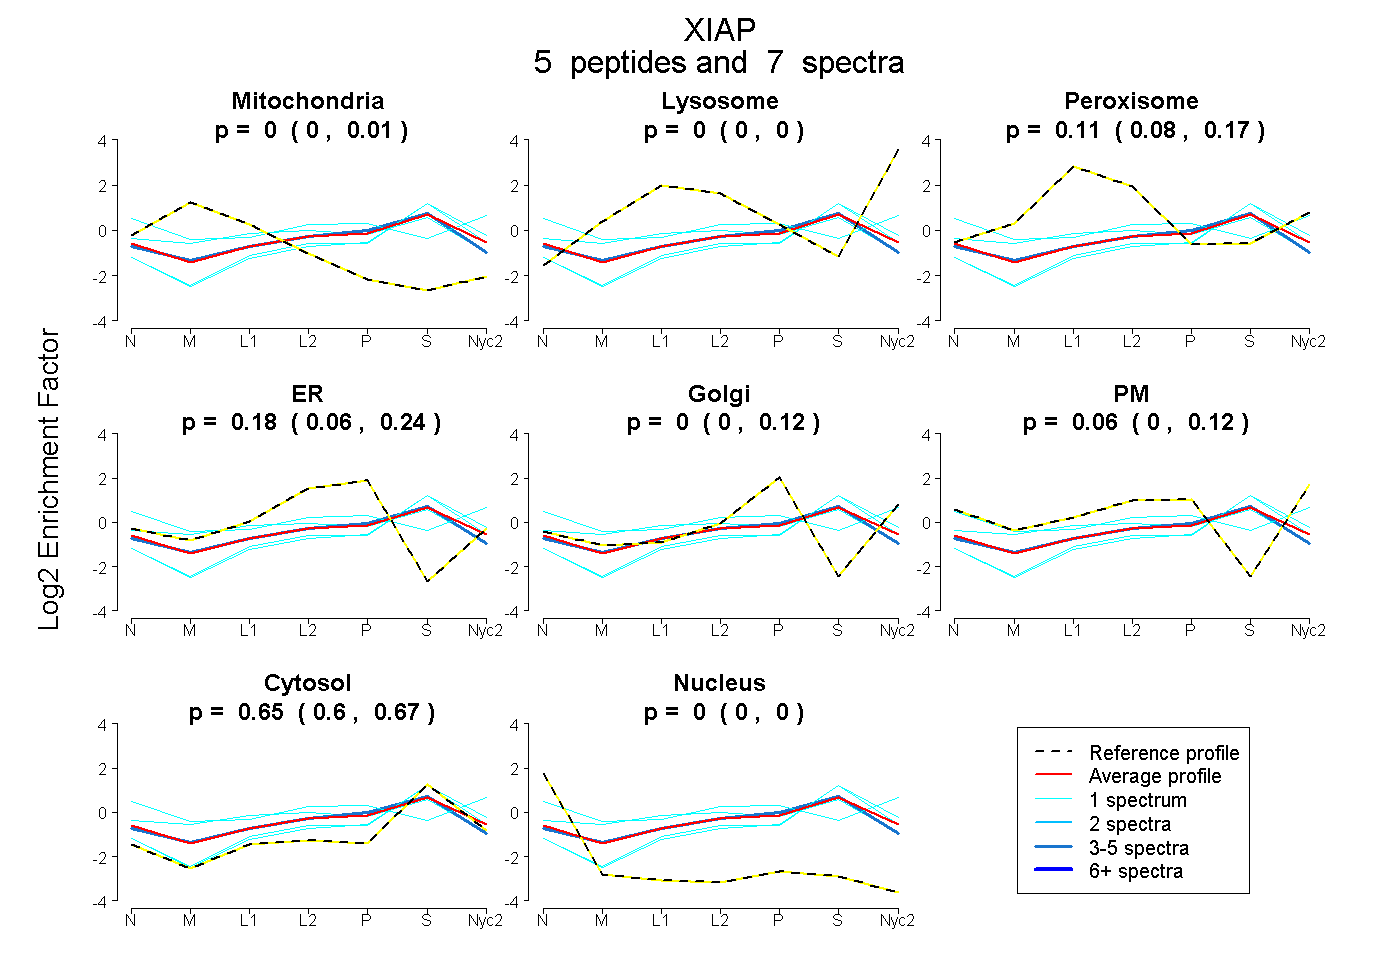
0.000 | 0.007
0.000 | 0.000
0.076 | 0.167
0.059 | 0.235
0.000 | 0.118
0.000 | 0.121
0.603 | 0.669
0.000 | 0.000
1peptide
spectrum
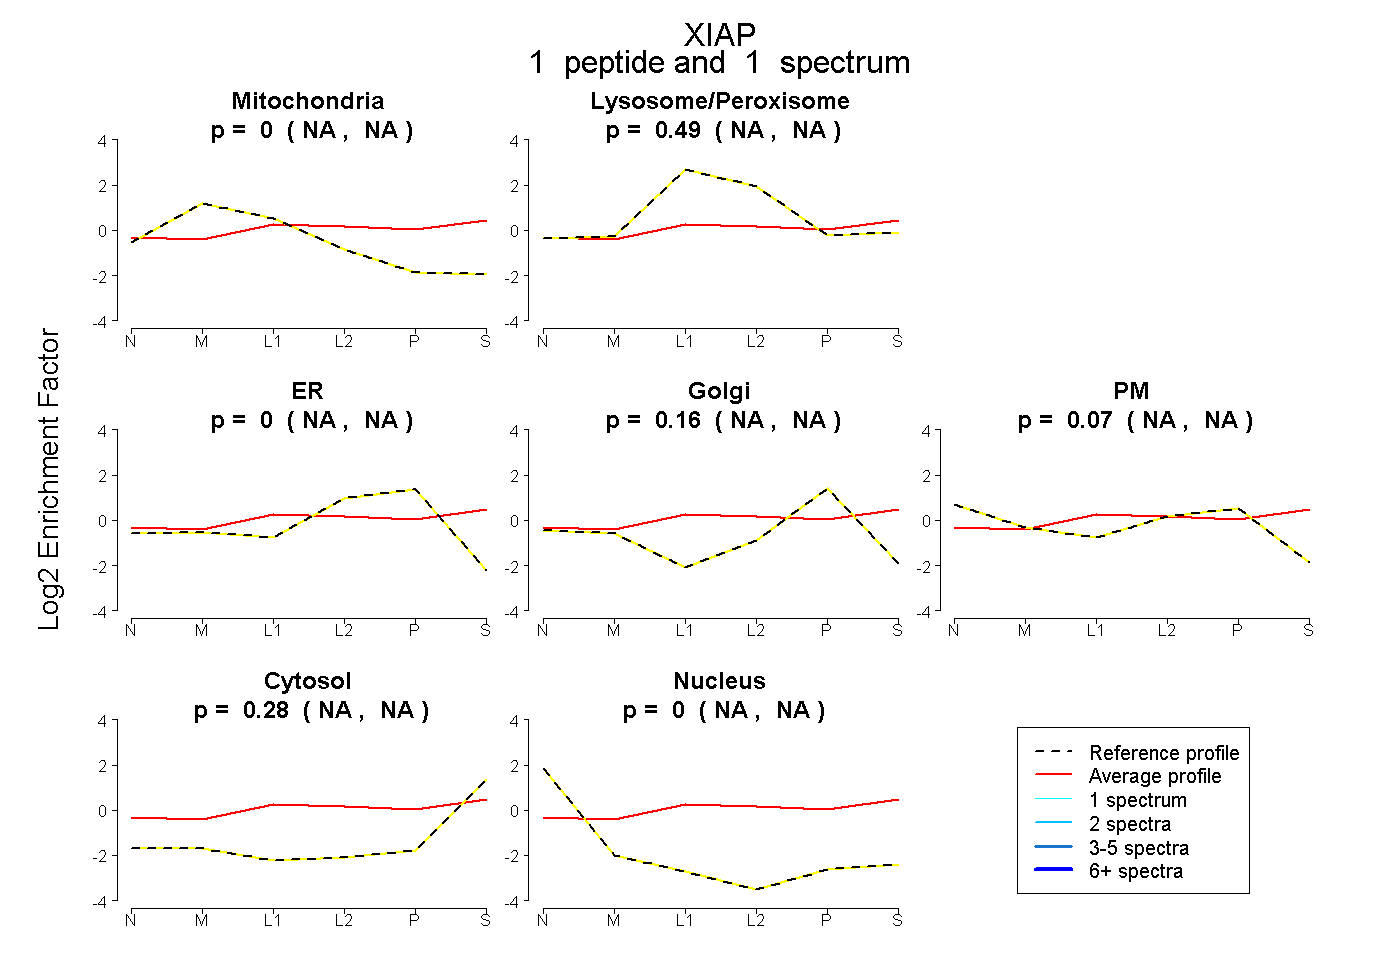
NA | NA
NA | NA
NA | NA
NA | NA
NA | NA
NA | NA
NA | NA
3peptides
spectra
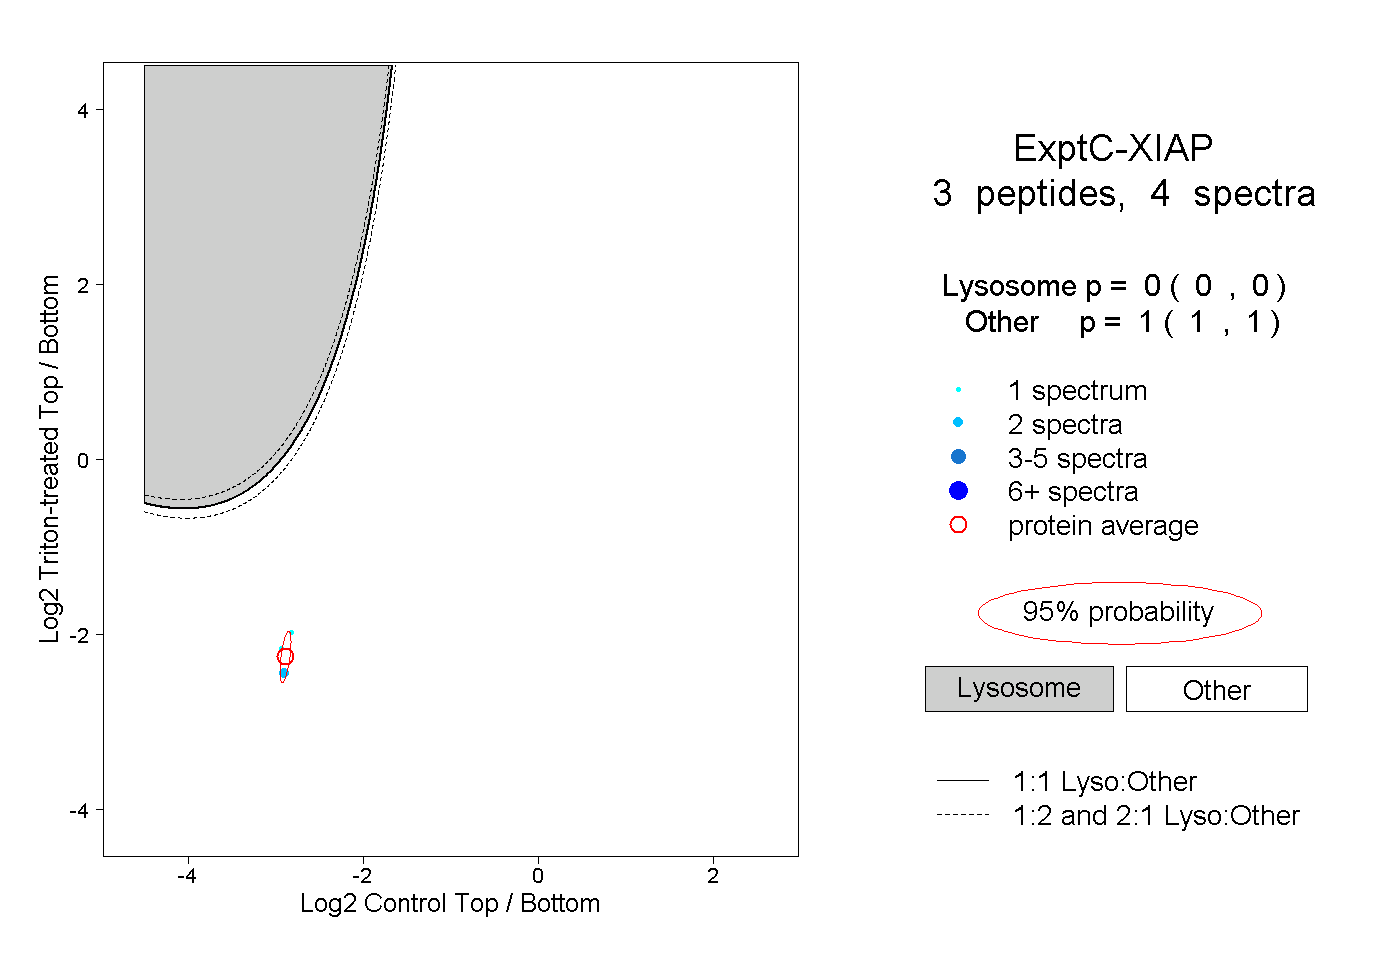
0.000 | 0.000
1.000 | 1.000