 5
5peptides
spectra
0.000 | 0.007
0.000 | 0.000
0.076 | 0.167
0.059 | 0.235
0.000 | 0.118
0.000 | 0.121
0.603 | 0.669
0.000 | 0.000
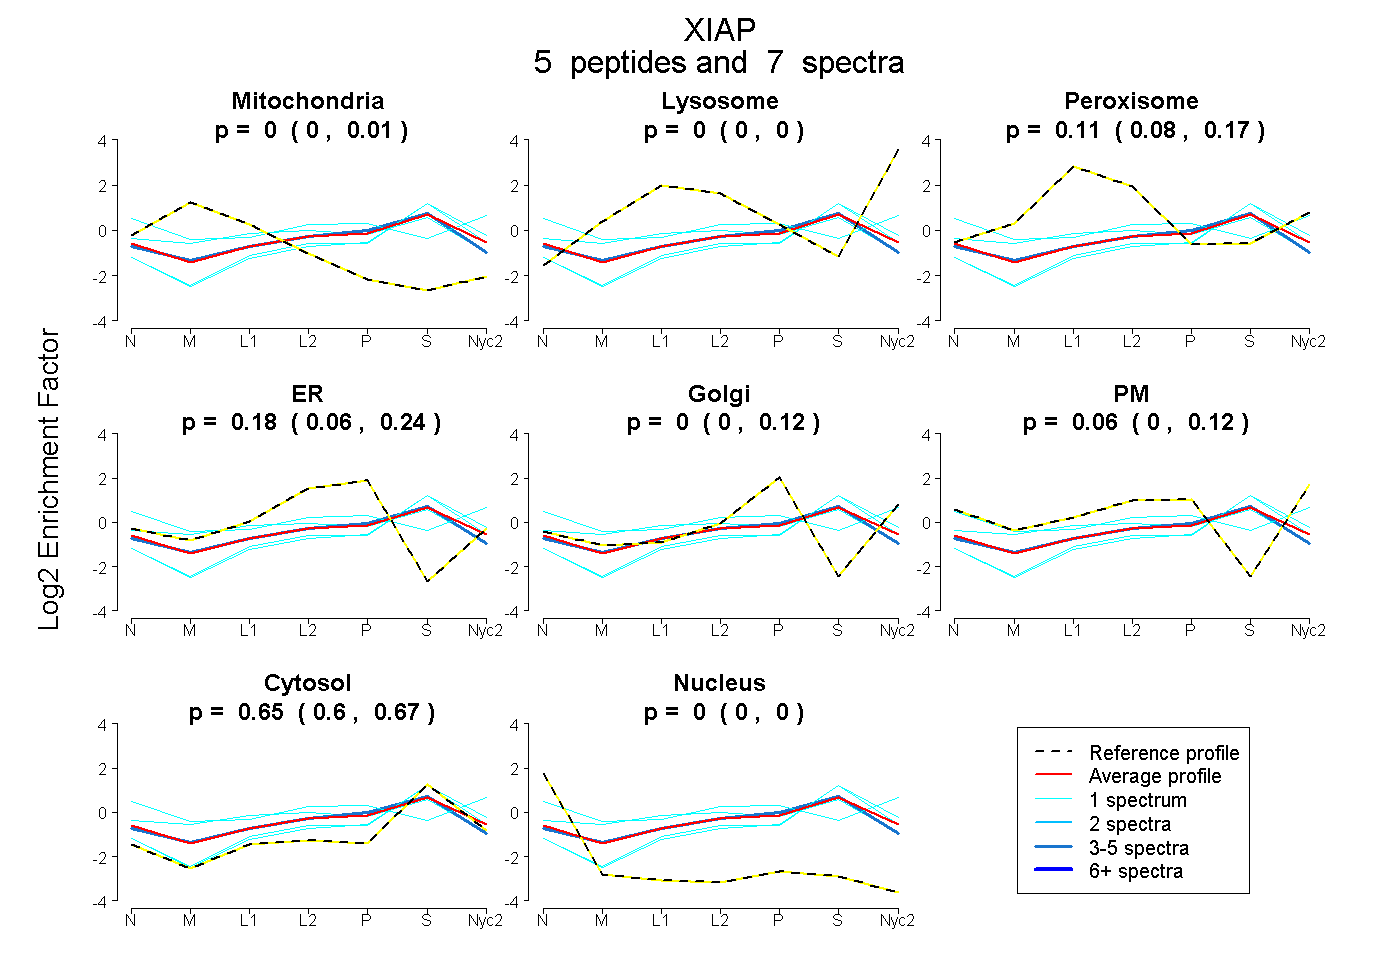
| Plot | Mito | Lyso | Perox | ER | Golgi | PM | Cytosol | Nucleus | |||||
| Expt A |
5 peptides |
7 spectra |
|
0.000 0.000 | 0.007 |
0.000 0.000 | 0.000 |
0.114 0.076 | 0.167 |
0.178 0.059 | 0.235 |
0.004 0.000 | 0.118 |
0.057 0.000 | 0.121 |
0.648 0.603 | 0.669 |
0.000 0.000 | 0.000 |
| 3 spectra, HFPNCFFVLGR | 0.000 | 0.000 | 0.095 | 0.250 | 0.000 | 0.000 | 0.655 | 0.000 | ||
| 1 spectrum, DISTEEQLR | 0.000 | 0.086 | 0.000 | 0.055 | 0.022 | 0.000 | 0.837 | 0.000 | ||
| 1 spectrum, SESGVSSDR | 0.000 | 0.019 | 0.000 | 0.095 | 0.022 | 0.000 | 0.863 | 0.000 | ||
| 1 spectrum, TPSVTK | 0.005 | 0.000 | 0.090 | 0.000 | 0.000 | 0.569 | 0.336 | 0.000 | ||
| 1 spectrum, AWSEHR | 0.096 | 0.000 | 0.234 | 0.169 | 0.000 | 0.000 | 0.501 | 0.000 |
| Plot | Mito | Lyso or Perox | ER | Golgi | PM | Cytosol | Nucleus | ||||||
| Expt B |
1 peptide |
1 spectrum |
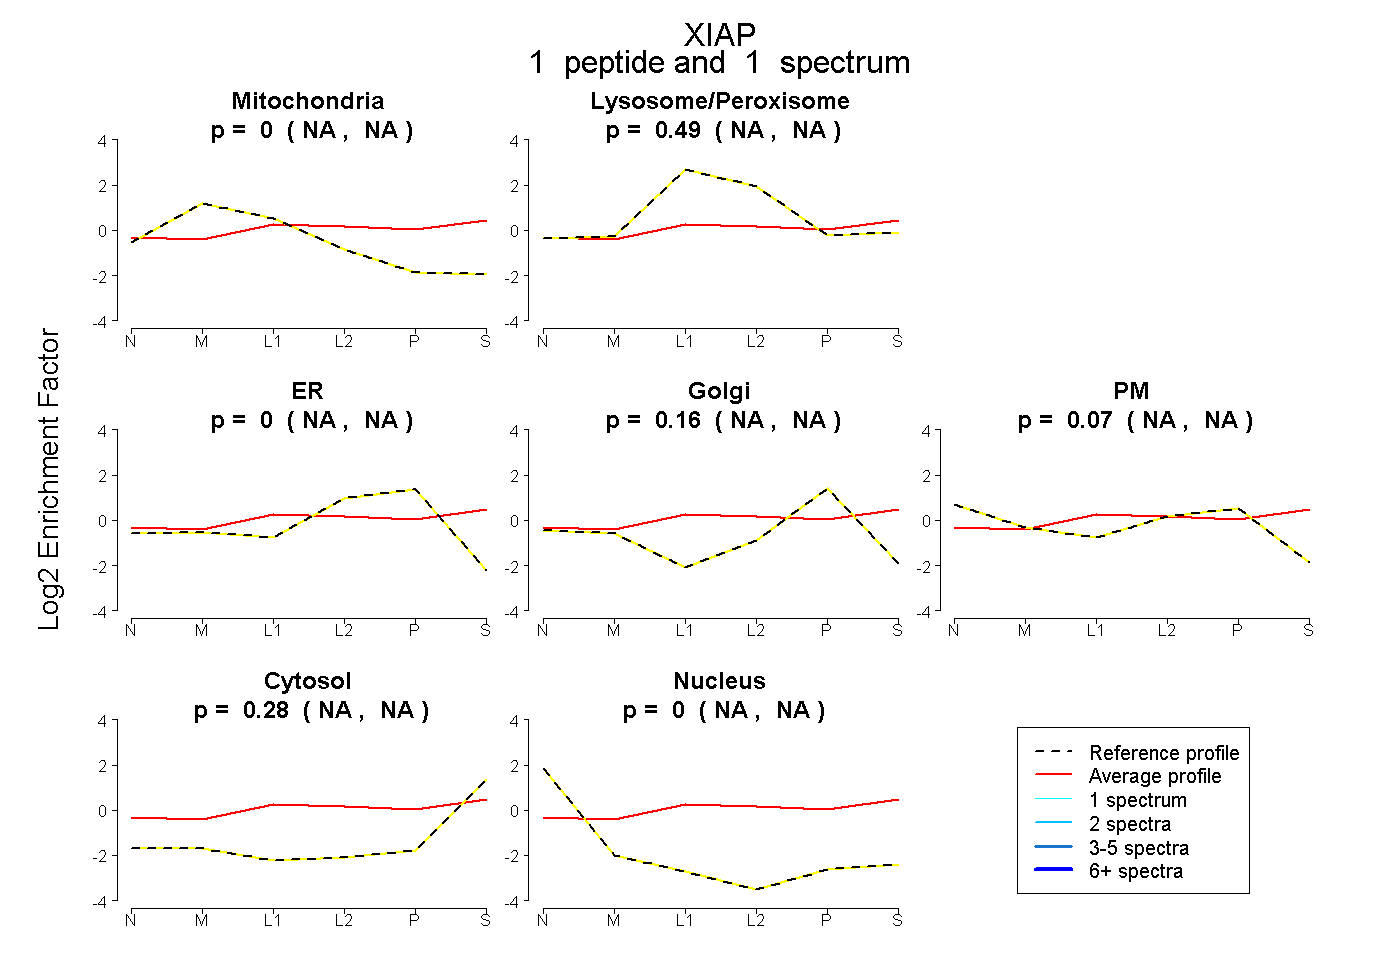 |
0.000 NA | NA |
0.490 NA | NA |
0.000 NA | NA |
0.157 NA | NA |
0.074 NA | NA |
0.278 NA | NA |
0.000 NA | NA |
|||
| Plot | Lyso | Other | |||||||||||
| Expt C |
3 peptides |
4 spectra |
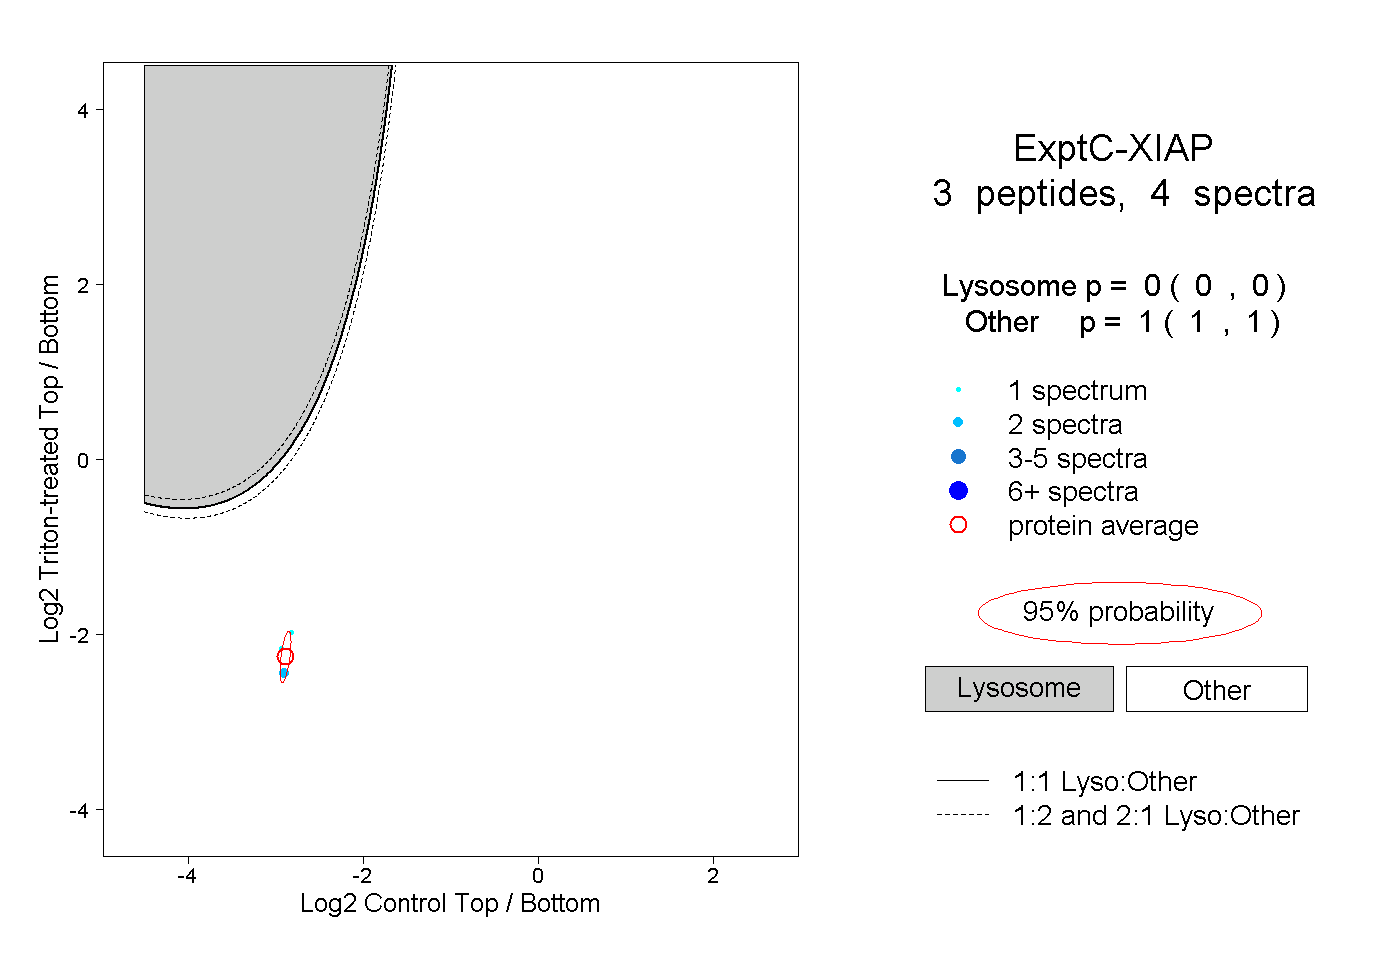 |
0.000 0.000 | 0.000 |
1.000 1.000 | 1.000 |