 6
6peptides
spectra
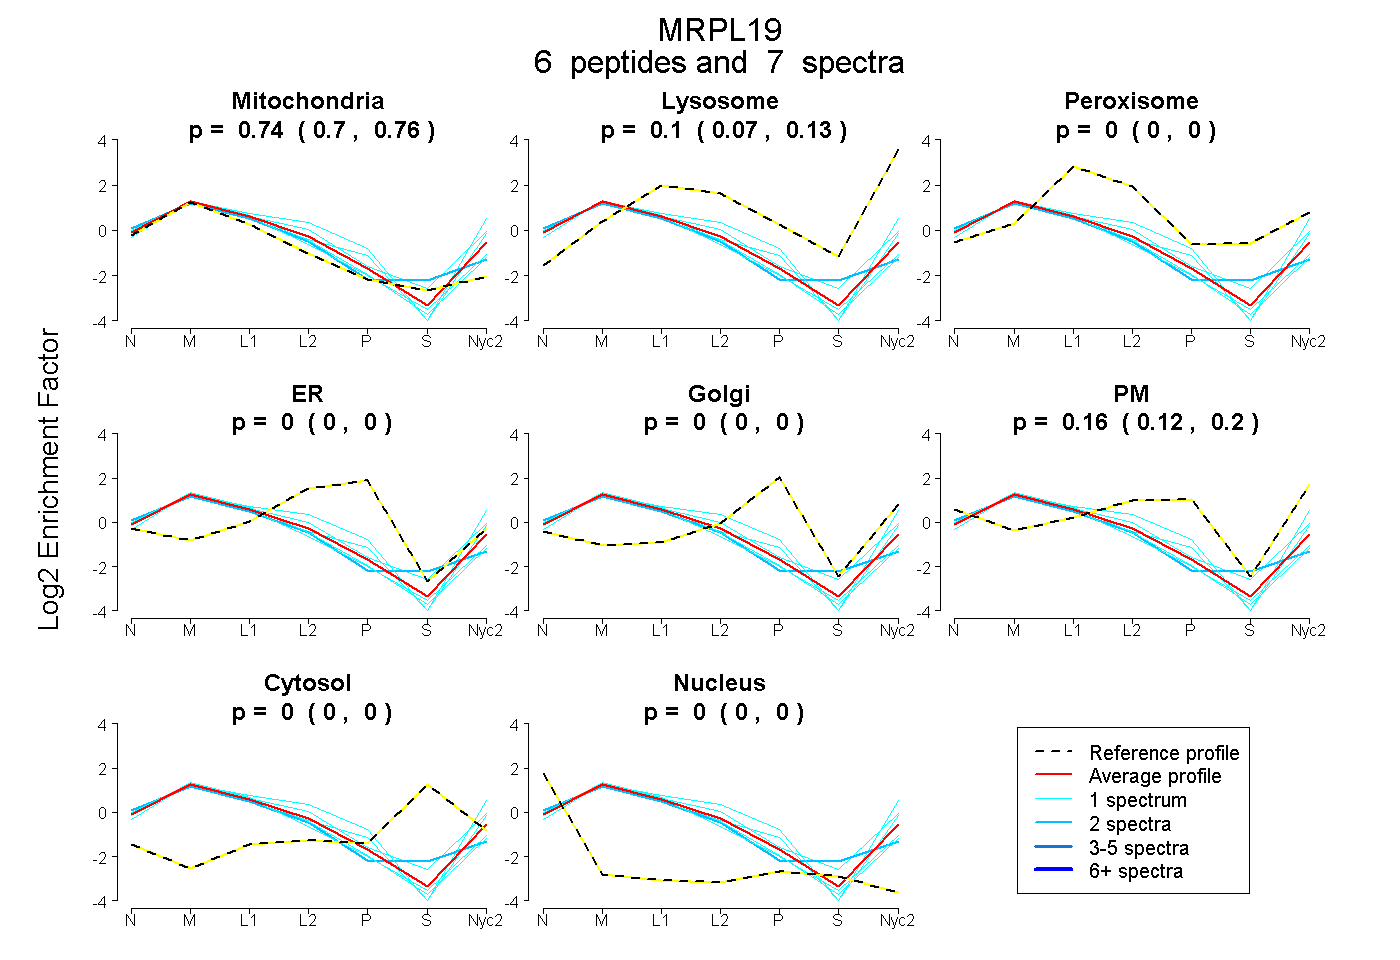
0.704 | 0.764
0.067 | 0.134
0.000 | 0.000
0.000 | 0.000
0.000 | 0.000
0.120 | 0.197
0.000 | 0.000
0.000 | 0.000
9peptides
spectra
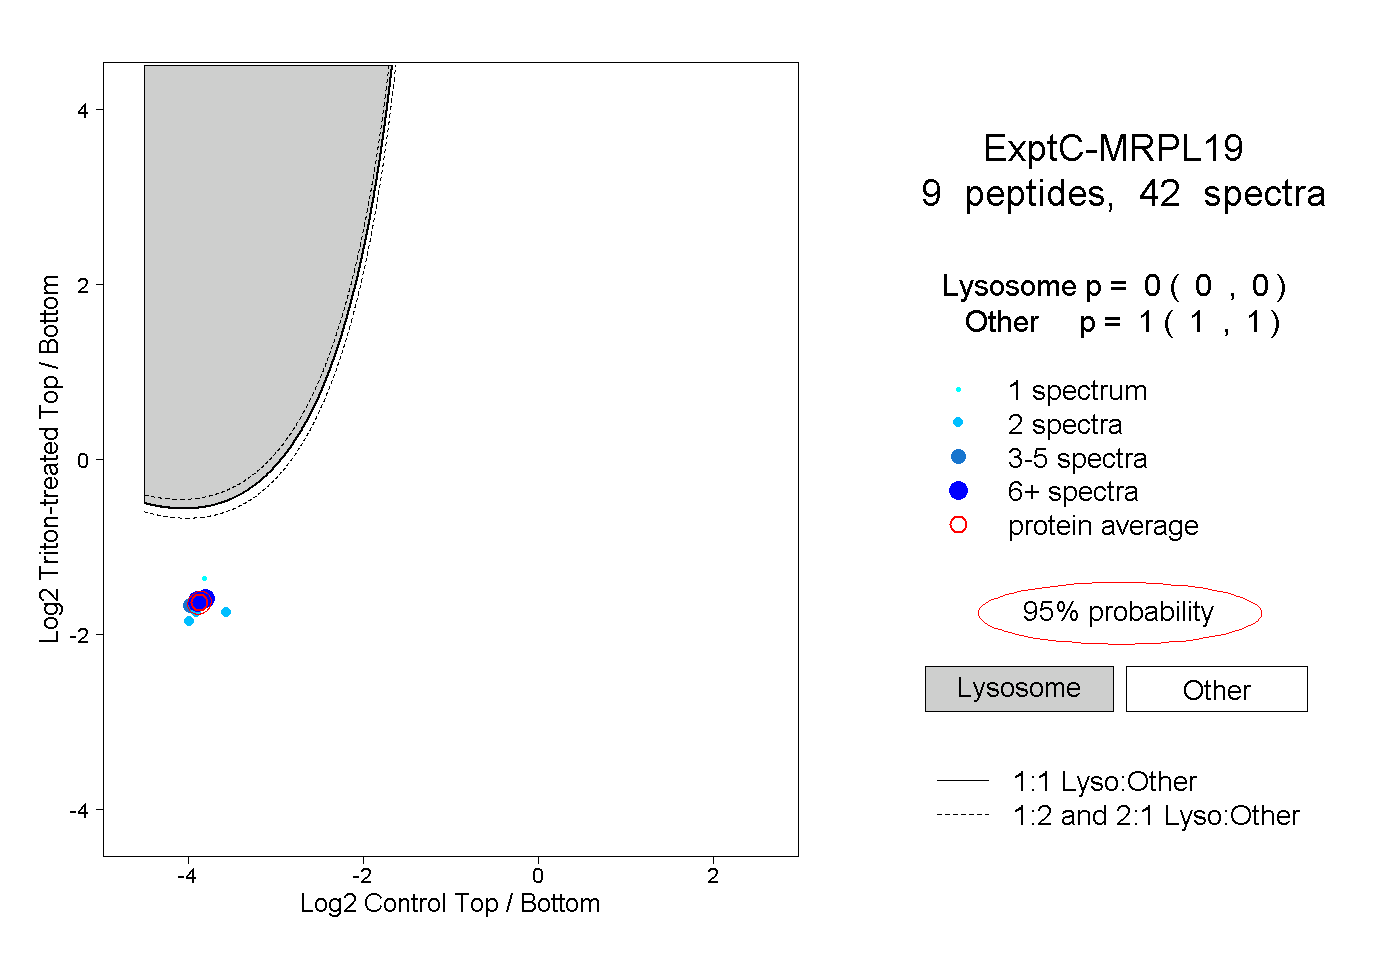
0.000 | 0.000
1.000 | 1.000
2peptides
spectra
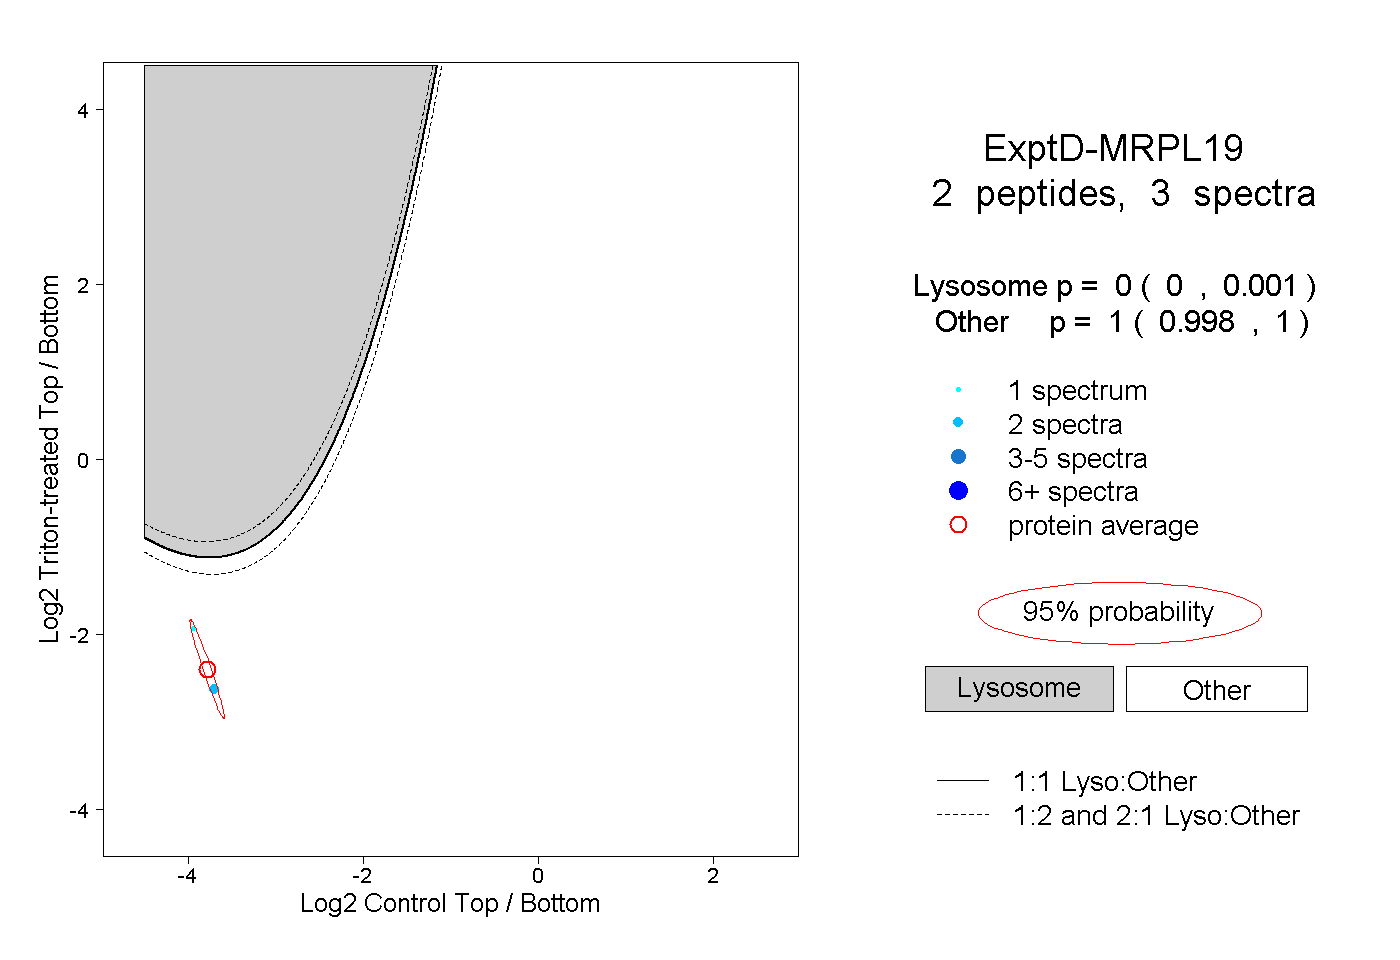
0.000 | 0.001
0.998 | 1.000