 6
6peptides
spectra
0.704 | 0.764
0.067 | 0.134
0.000 | 0.000
0.000 | 0.000
0.000 | 0.000
0.120 | 0.197
0.000 | 0.000
0.000 | 0.000
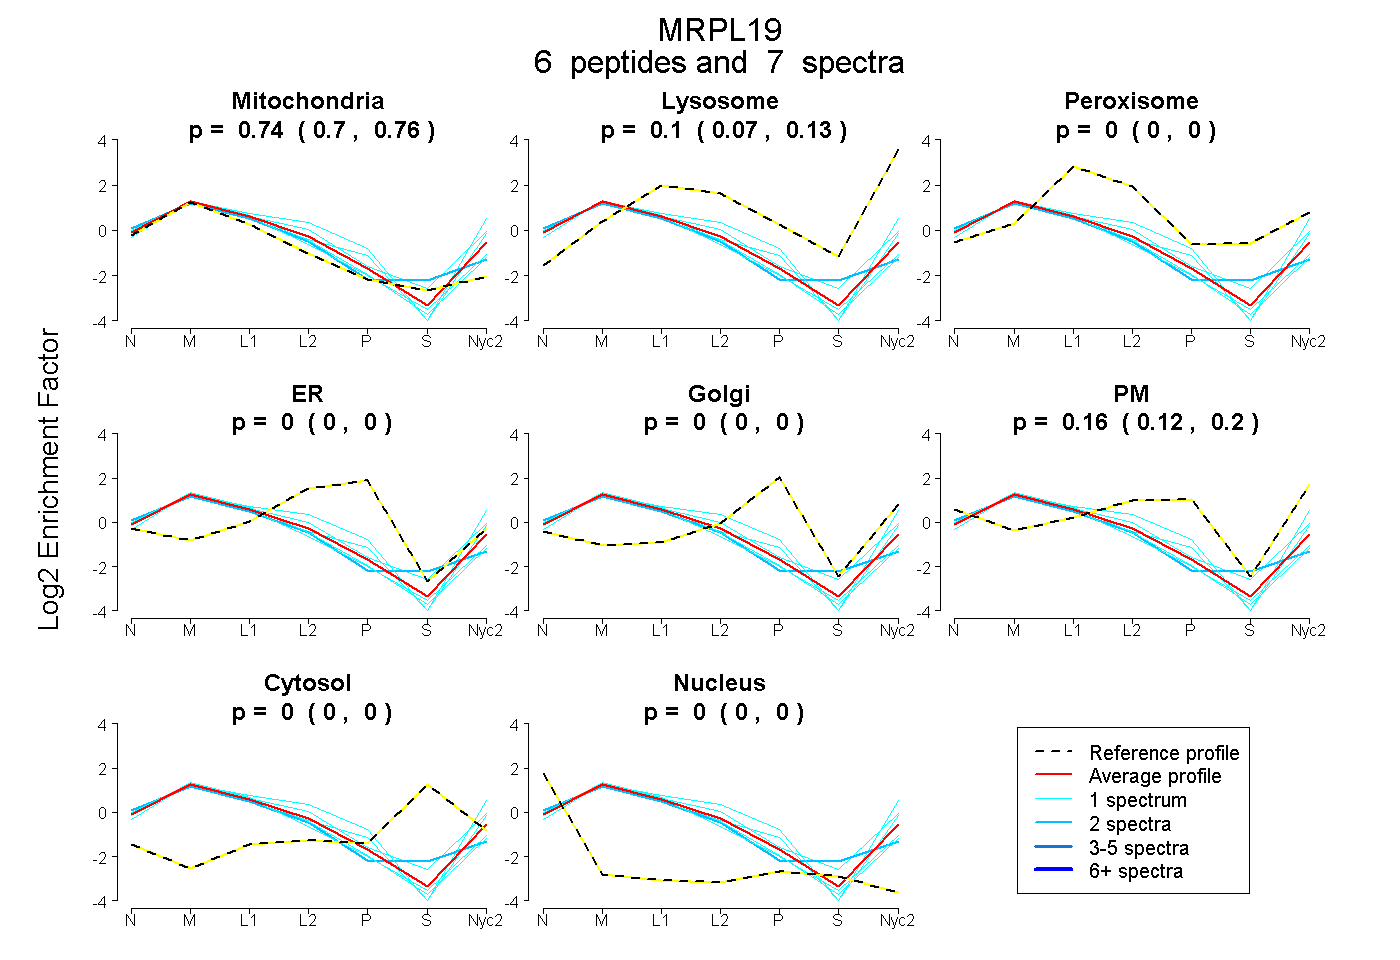
| Plot | Mito | Lyso | Perox | ER | Golgi | PM | Cytosol | Nucleus | |||||
| Expt A |
6 peptides |
7 spectra |
|
0.736 0.704 | 0.764 |
0.104 0.067 | 0.134 |
0.000 0.000 | 0.000 |
0.000 0.000 | 0.000 |
0.000 0.000 | 0.000 |
0.160 0.120 | 0.197 |
0.000 0.000 | 0.000 |
0.000 0.000 | 0.000 |
| 1 spectrum, VTTADPYASGK | 0.559 | 0.047 | 0.000 | 0.000 | 0.000 | 0.394 | 0.000 | 0.000 | ||
| 1 spectrum, TSQFLGICIK | 0.851 | 0.029 | 0.000 | 0.000 | 0.000 | 0.120 | 0.000 | 0.000 | ||
| 2 spectra, IHEIQVVK | 0.805 | 0.013 | 0.153 | 0.000 | 0.000 | 0.012 | 0.000 | 0.016 | ||
| 1 spectrum, FDLALTEEQMK | 0.570 | 0.108 | 0.000 | 0.000 | 0.000 | 0.321 | 0.000 | 0.000 | ||
| 1 spectrum, SGSGLGATFTLR | 0.844 | 0.030 | 0.000 | 0.000 | 0.000 | 0.126 | 0.000 | 0.000 | ||
| 1 spectrum, IEAALWEEIEASK | 0.668 | 0.267 | 0.000 | 0.000 | 0.000 | 0.065 | 0.000 | 0.000 |
| Plot | Lyso | Other | |||||||||||
| Expt C |
9 peptides |
42 spectra |
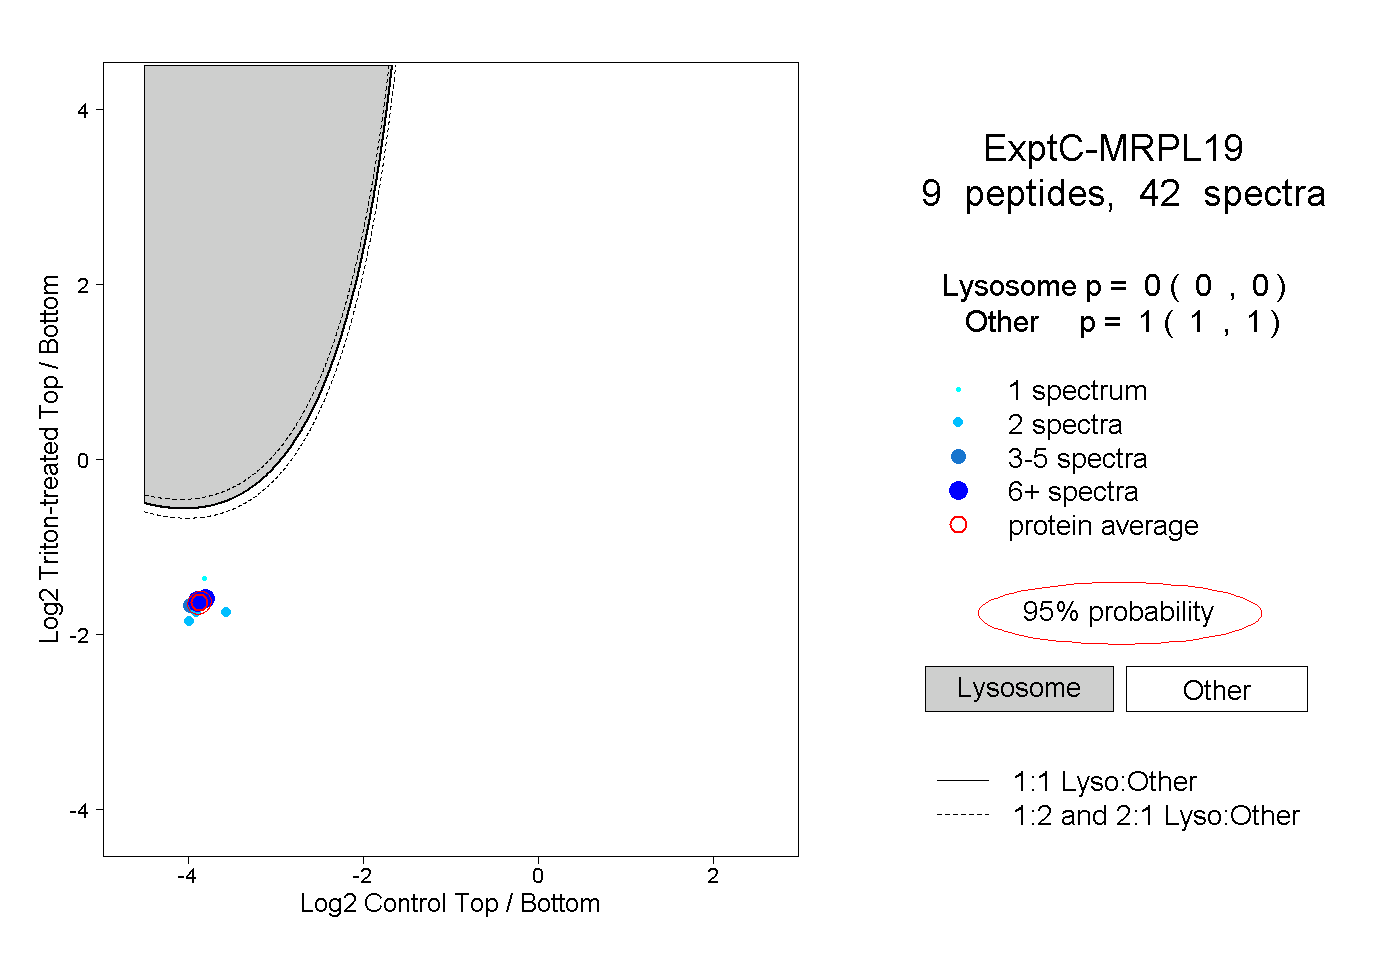 |
0.000 0.000 | 0.000 |
1.000 1.000 | 1.000 |
||||||||
| Plot | Lyso | Other | |||||||||||
| Expt D |
2 peptides |
3 spectra |
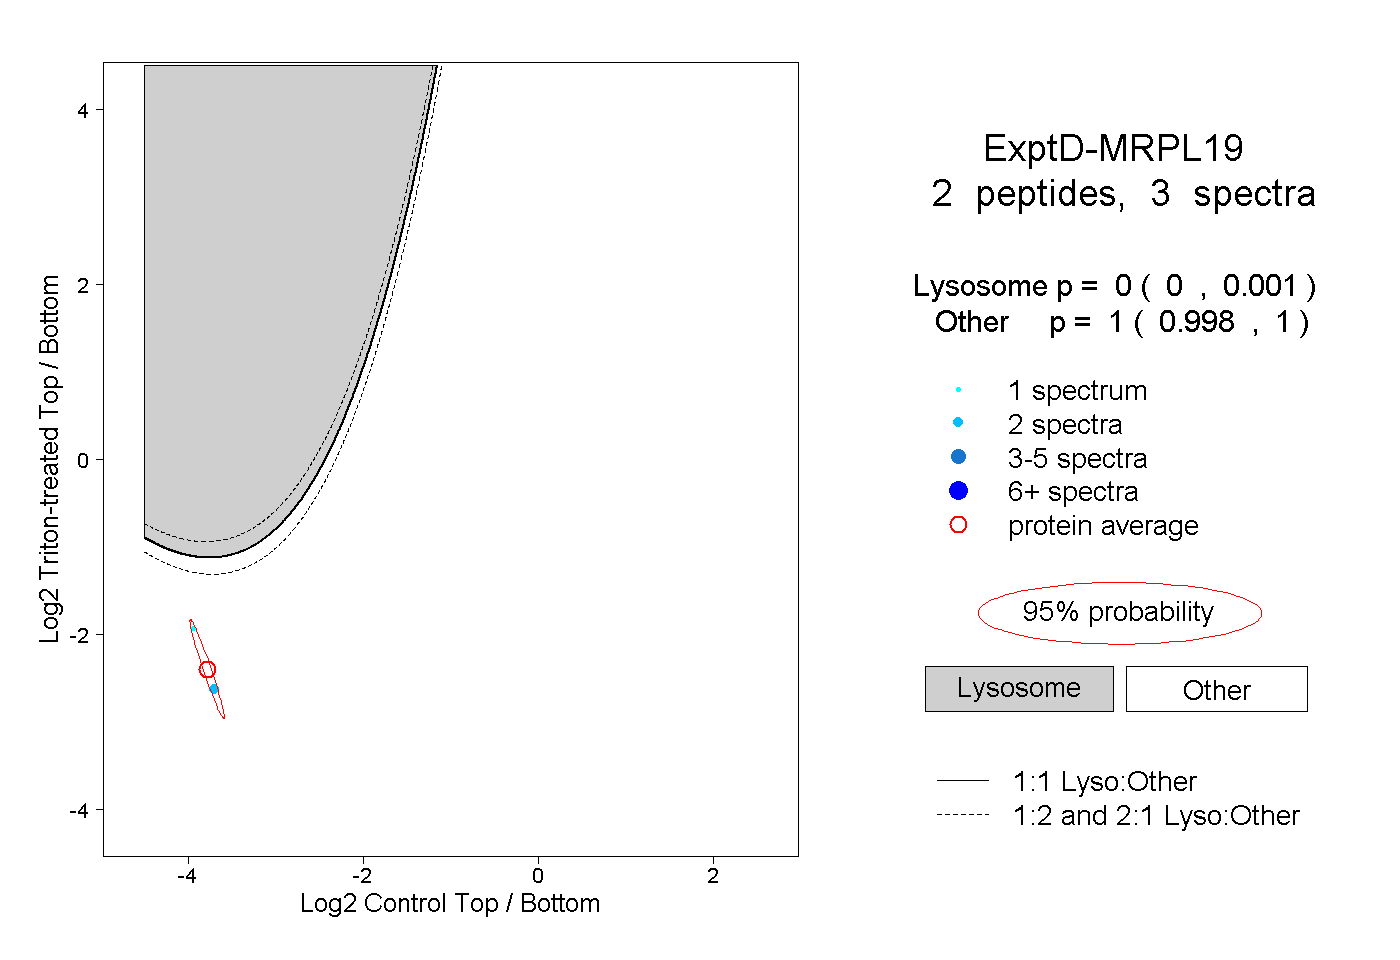 |
0.000 0.000 | 0.001 |
1.000 0.998 | 1.000 |