 5
5peptides
spectra
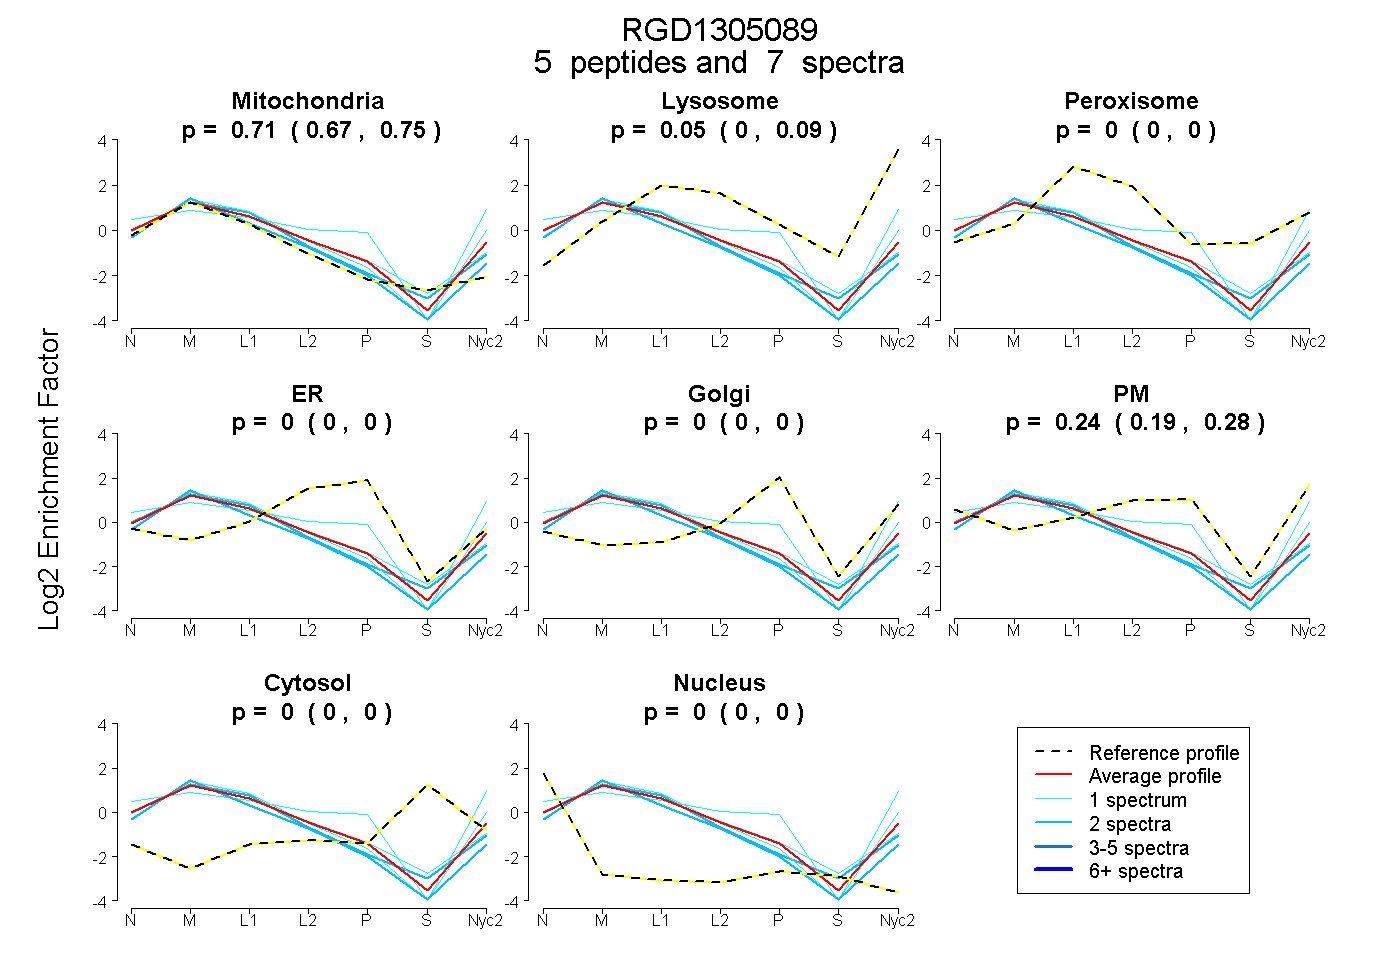
0.669 | 0.750
0.000 | 0.088
0.000 | 0.000
0.000 | 0.000
0.000 | 0.000
0.187 | 0.283
0.000 | 0.000
0.000 | 0.000
1peptide
spectrum
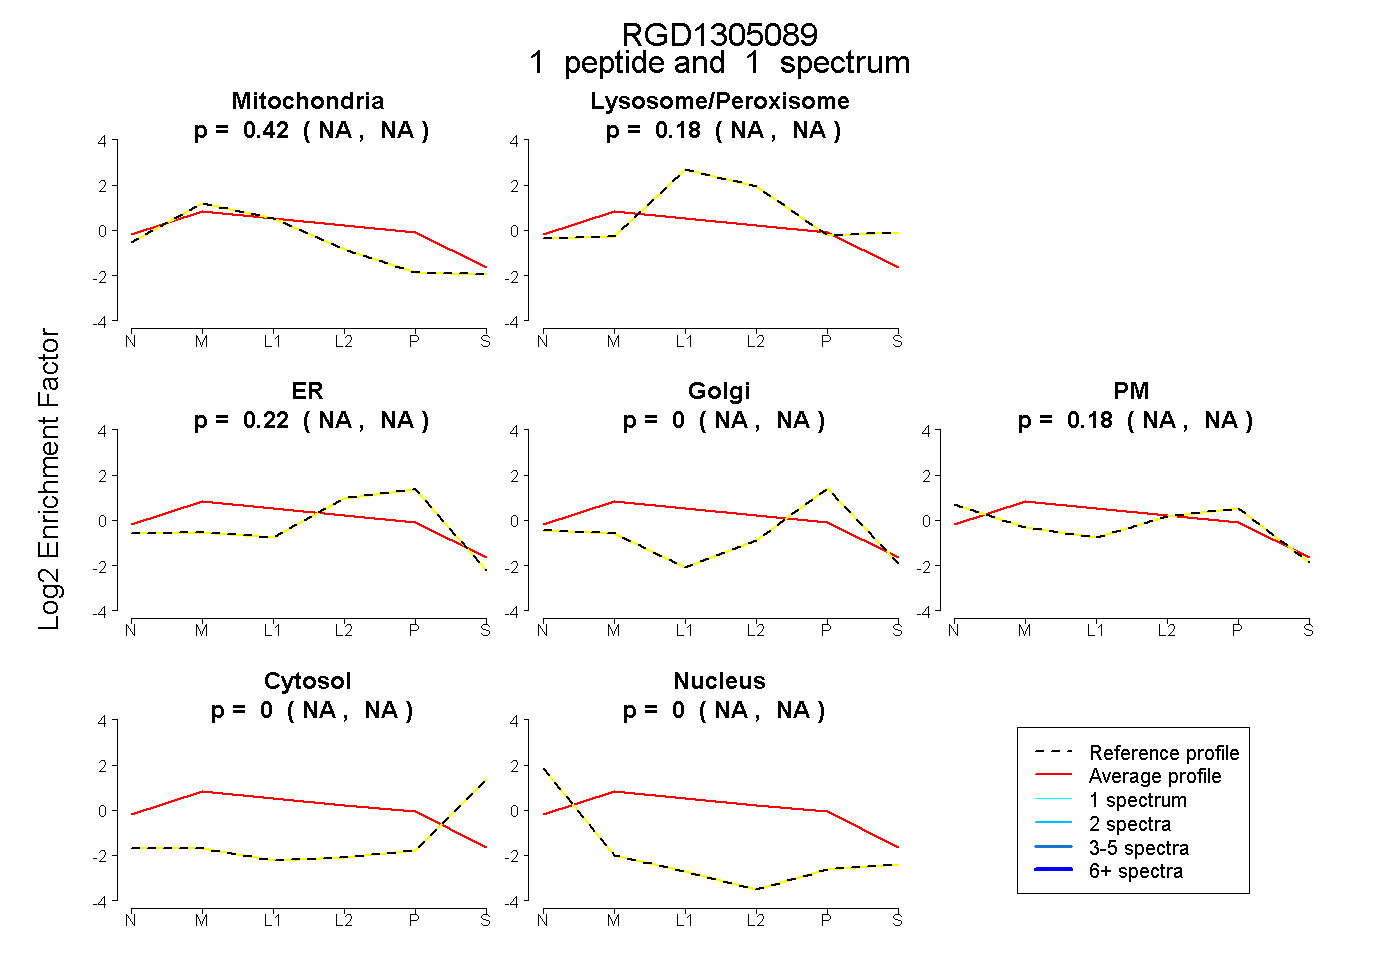
NA | NA
NA | NA
NA | NA
NA | NA
NA | NA
NA | NA
NA | NA
11peptides
spectra
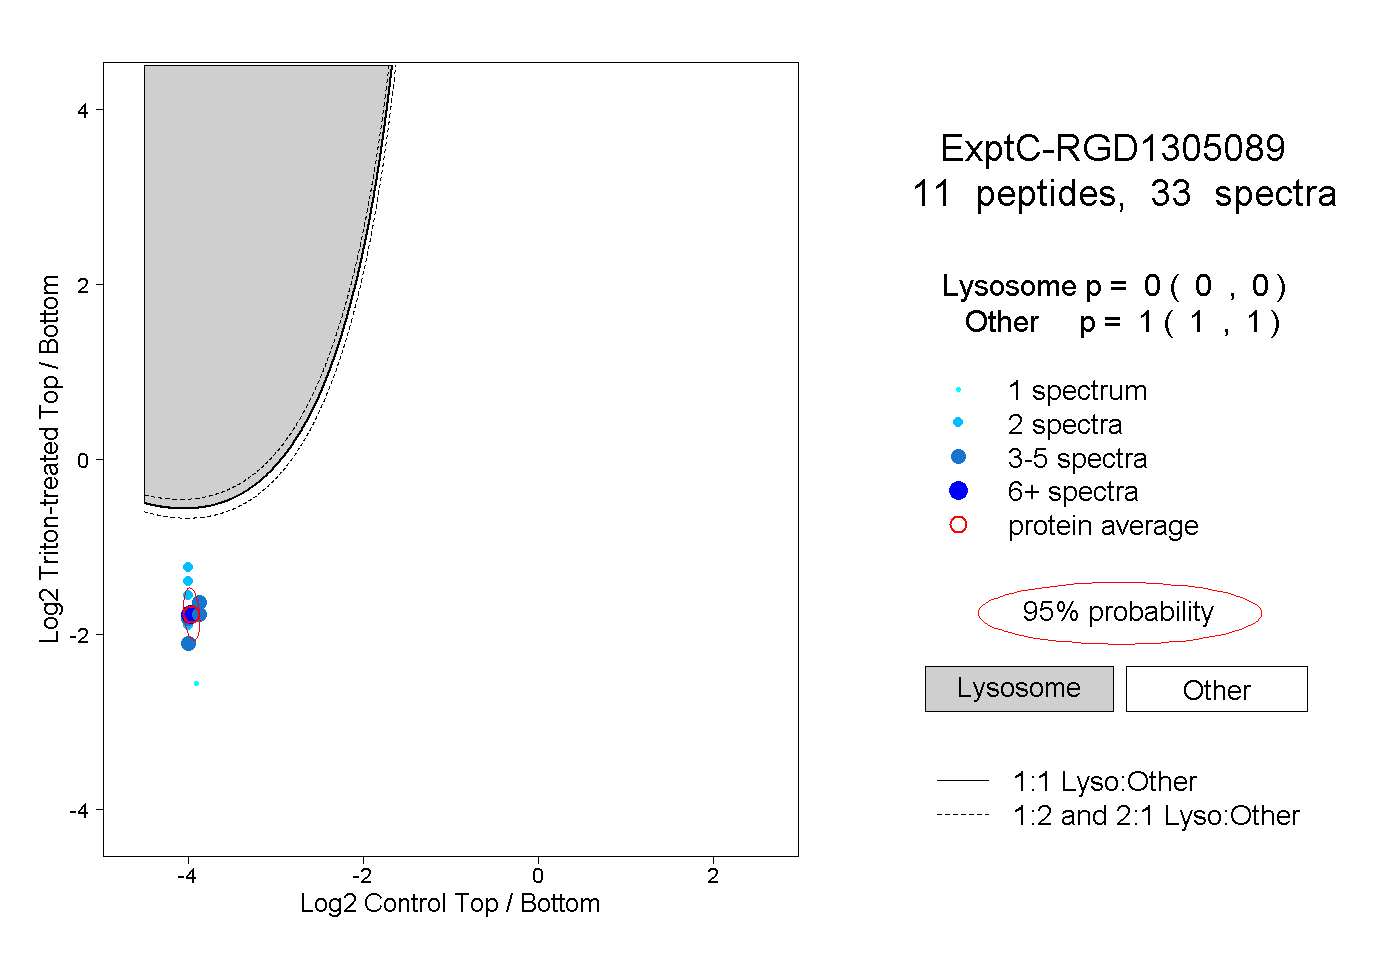
0.000 | 0.000
1.000 | 1.000
2peptides
spectra
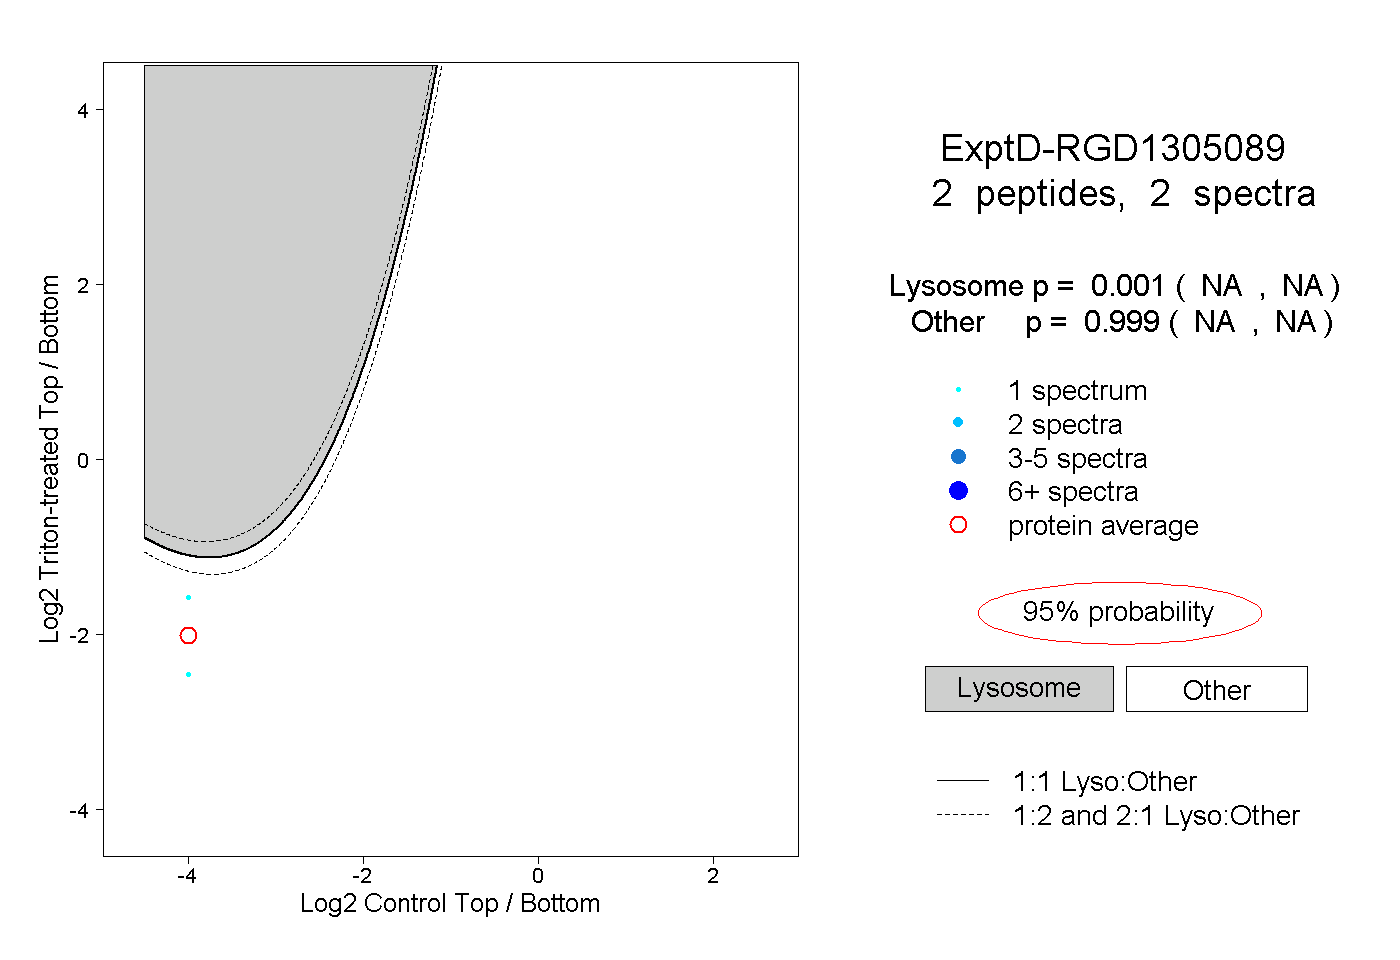
NA | NA
NA | NA