RGD1305089
[ENSRNOP00000009306]
Main page
| | | Plot |
Mito |
Lyso |
|
Perox |
ER |
Golgi |
PM |
Cytosol |
Nucleus |
|
| Expt A |
 5
5
peptides |
7
spectra |
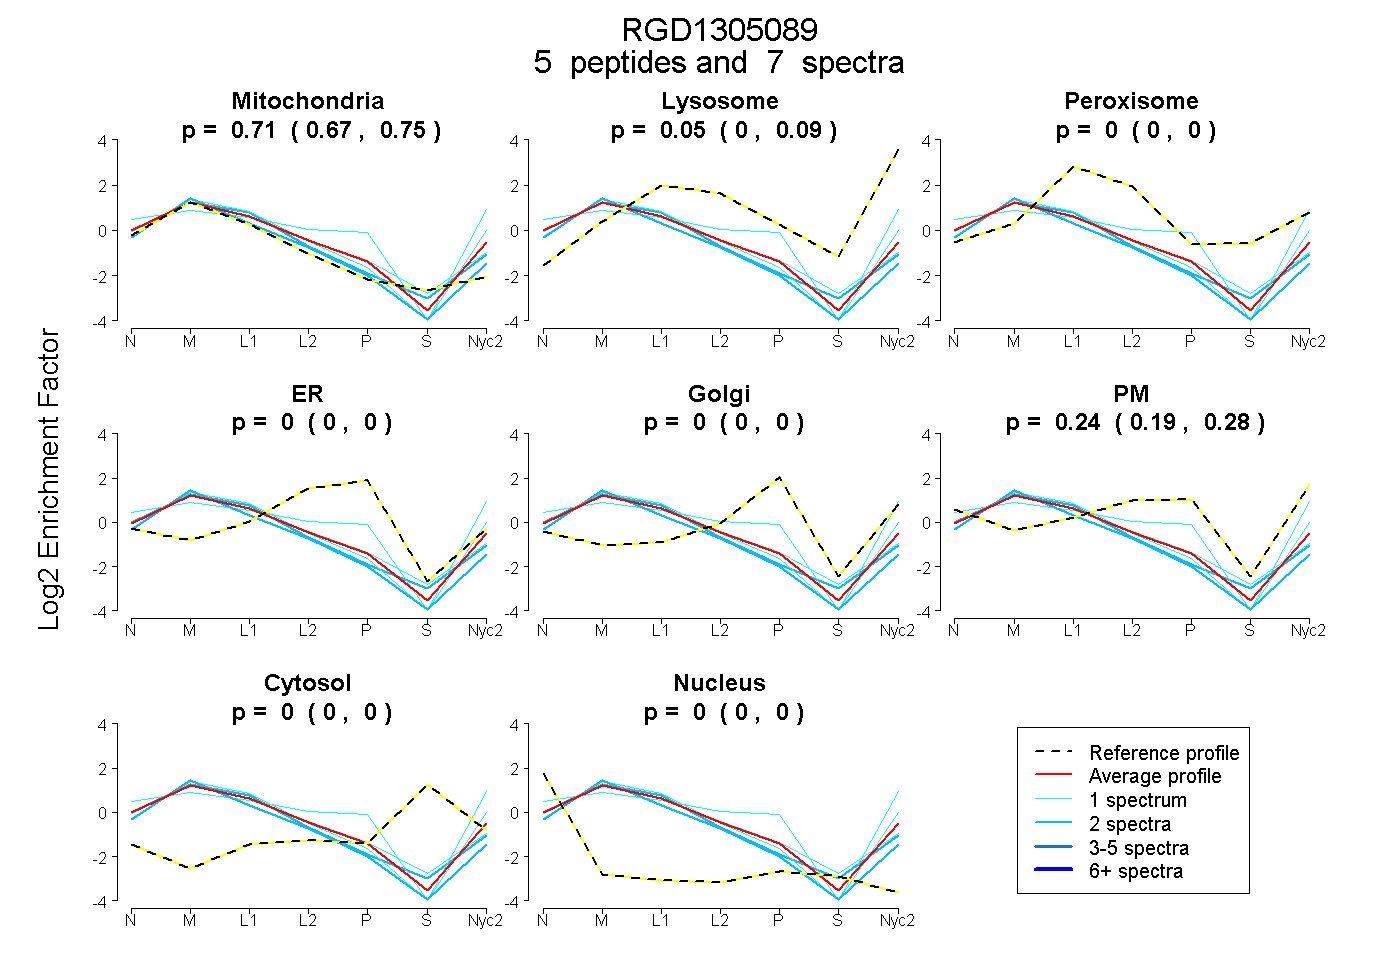 |
0.711
0.669 | 0.750 |
0.050
0.000 | 0.088 |
|
0.000
0.000 | 0.000 |
0.000
0.000 | 0.000 |
0.000
0.000 | 0.000 |
0.239
0.187 | 0.283 |
0.000
0.000 | 0.000 |
0.000
0.000 | 0.000 |
|
| | | Plot |
Mito |
|
Lyso or Perox |
|
ER |
Golgi |
PM |
Cytosol |
Nucleus |
|
| Expt B |
1
peptide |
1
spectrum |
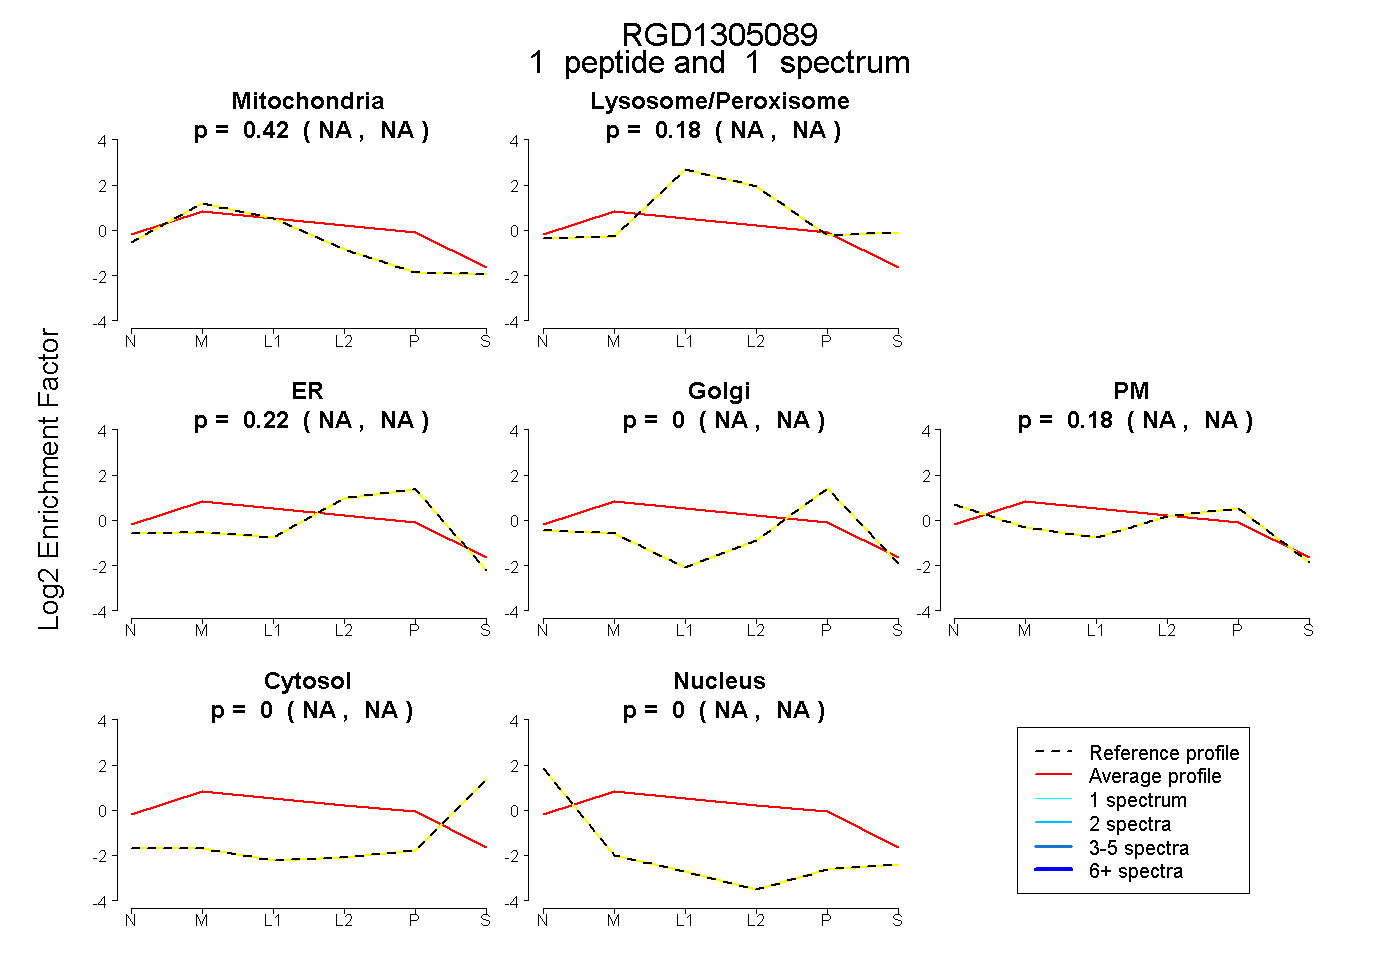 |
0.421
NA | NA |
|
0.183
NA | NA |
|
0.220
NA | NA |
0.000
NA | NA |
0.176
NA | NA |
0.000
NA | NA |
0.000
NA | NA |
|
| | | Plot |
|
Lyso |
|
|
|
|
|
|
|
Other |
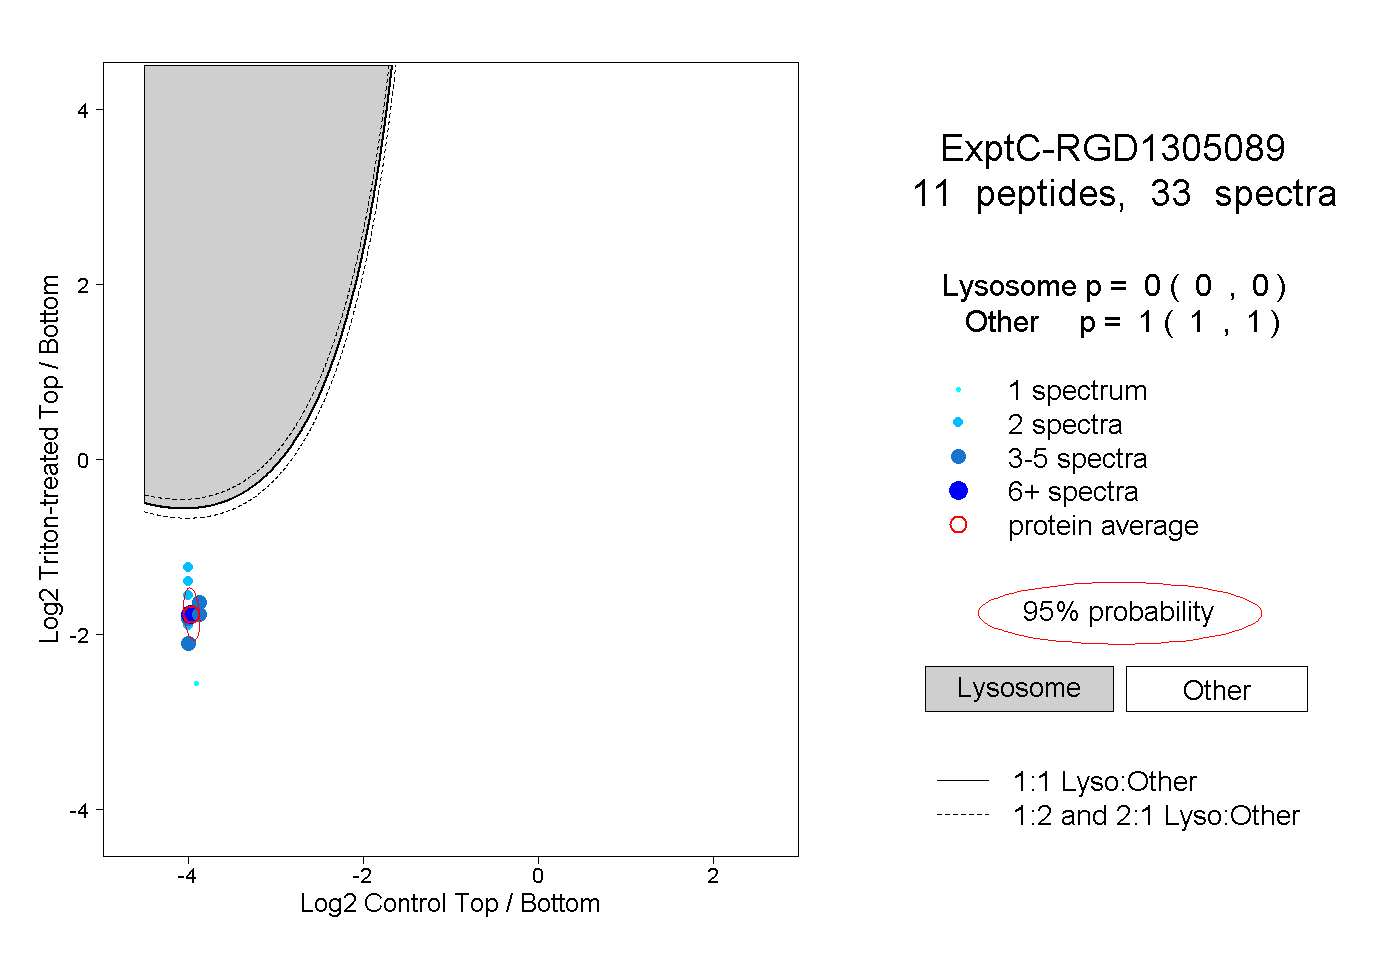
| Expt C |
11
peptides |
33
spectra |
 |
|
0.000
0.000 | 0.000 |
|
|
|
|
|
|
|
1.000
1.000 | 1.000 |
| 2 spectra, ACLPDAR |
|
0.000 |
|
|
|
|
|
|
|
1.000 |
| 5 spectra, SSCEVPTK |
|
0.000 |
|
|
|
|
|
|
|
1.000 |
| 2 spectra, SLESGGYTLLIR |
|
0.000 |
|
|
|
|
|
|
|
1.000 |
| 1 spectrum, WQQGHQLAITK |
|
0.000 |
|
|
|
|
|
|
|
1.000 |
| 8 spectra, SCSSVDVAK |
|
0.000 |
|
|
|
|
|
|
|
1.000 |
| 2 spectra, AFFDHGK |
|
0.000 |
|
|
|
|
|
|
|
1.000 |
| 3 spectra, TTPQELK |
|
0.000 |
|
|
|
|
|
|
|
1.000 |
| 2 spectra, DVIDGGDQYK |
|
0.000 |
|
|
|
|
|
|
|
1.000 |
| 3 spectra, GQFTTIQK |
|
0.000 |
|
|
|
|
|
|
|
1.000 |
| 2 spectra, ILNLLVTK |
|
0.000 |
|
|
|
|
|
|
|
1.000 |
| 3 spectra, WLCLQR |
|
0.000 |
|
|
|
|
|
|
|
1.000 |
| | | Plot |
|
Lyso |
|
|
|
|
|
|
|
Other |
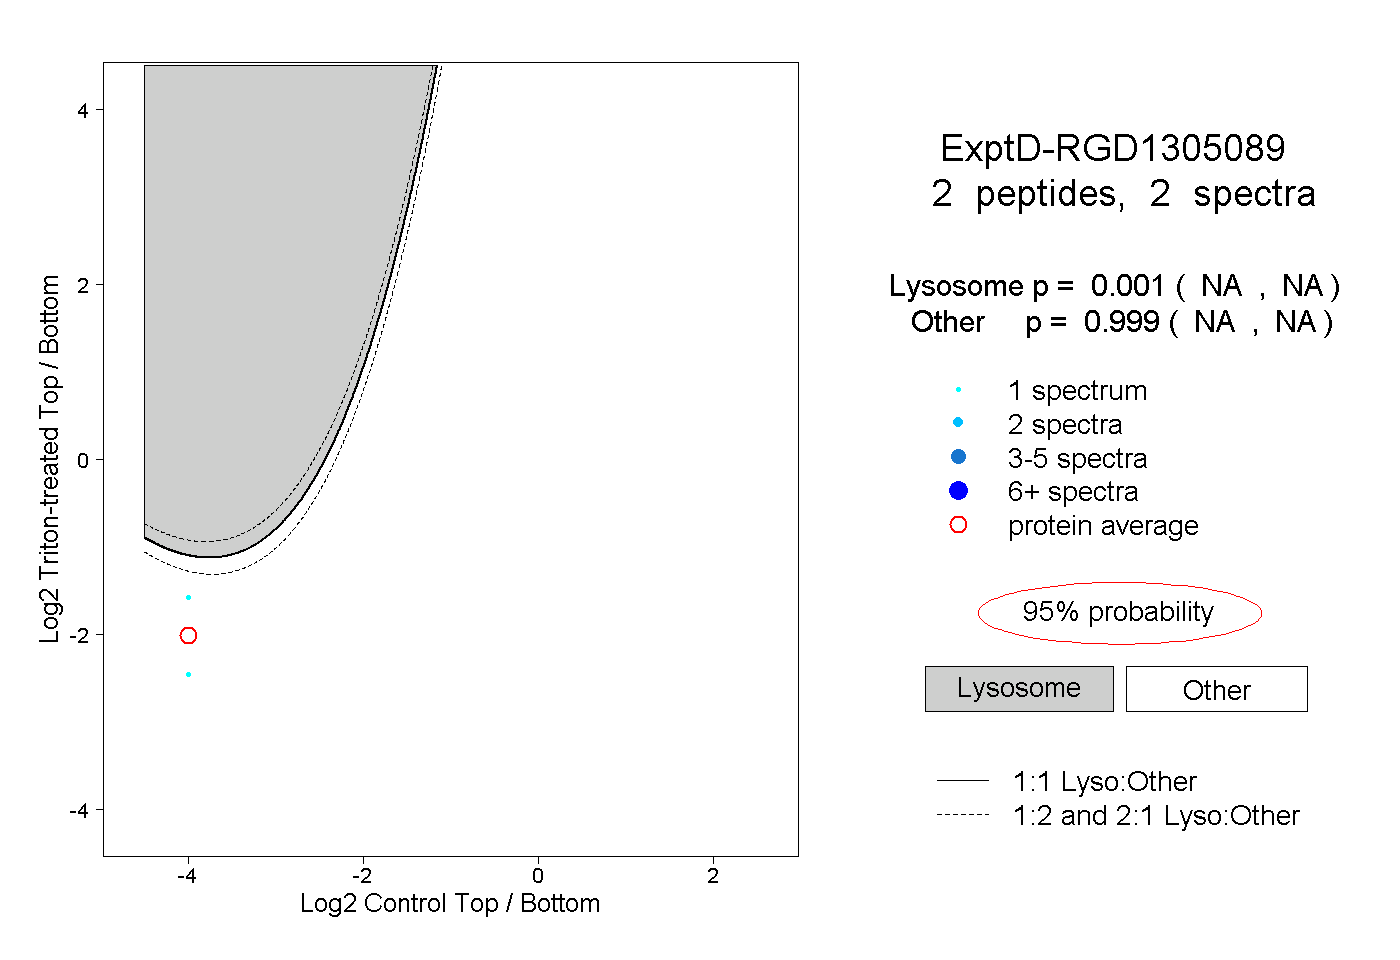
| Expt D |
2
peptides |
2
spectra |
 |
|
0.001
NA | NA |
|
|
|
|
|
|
|
0.999
NA | NA |